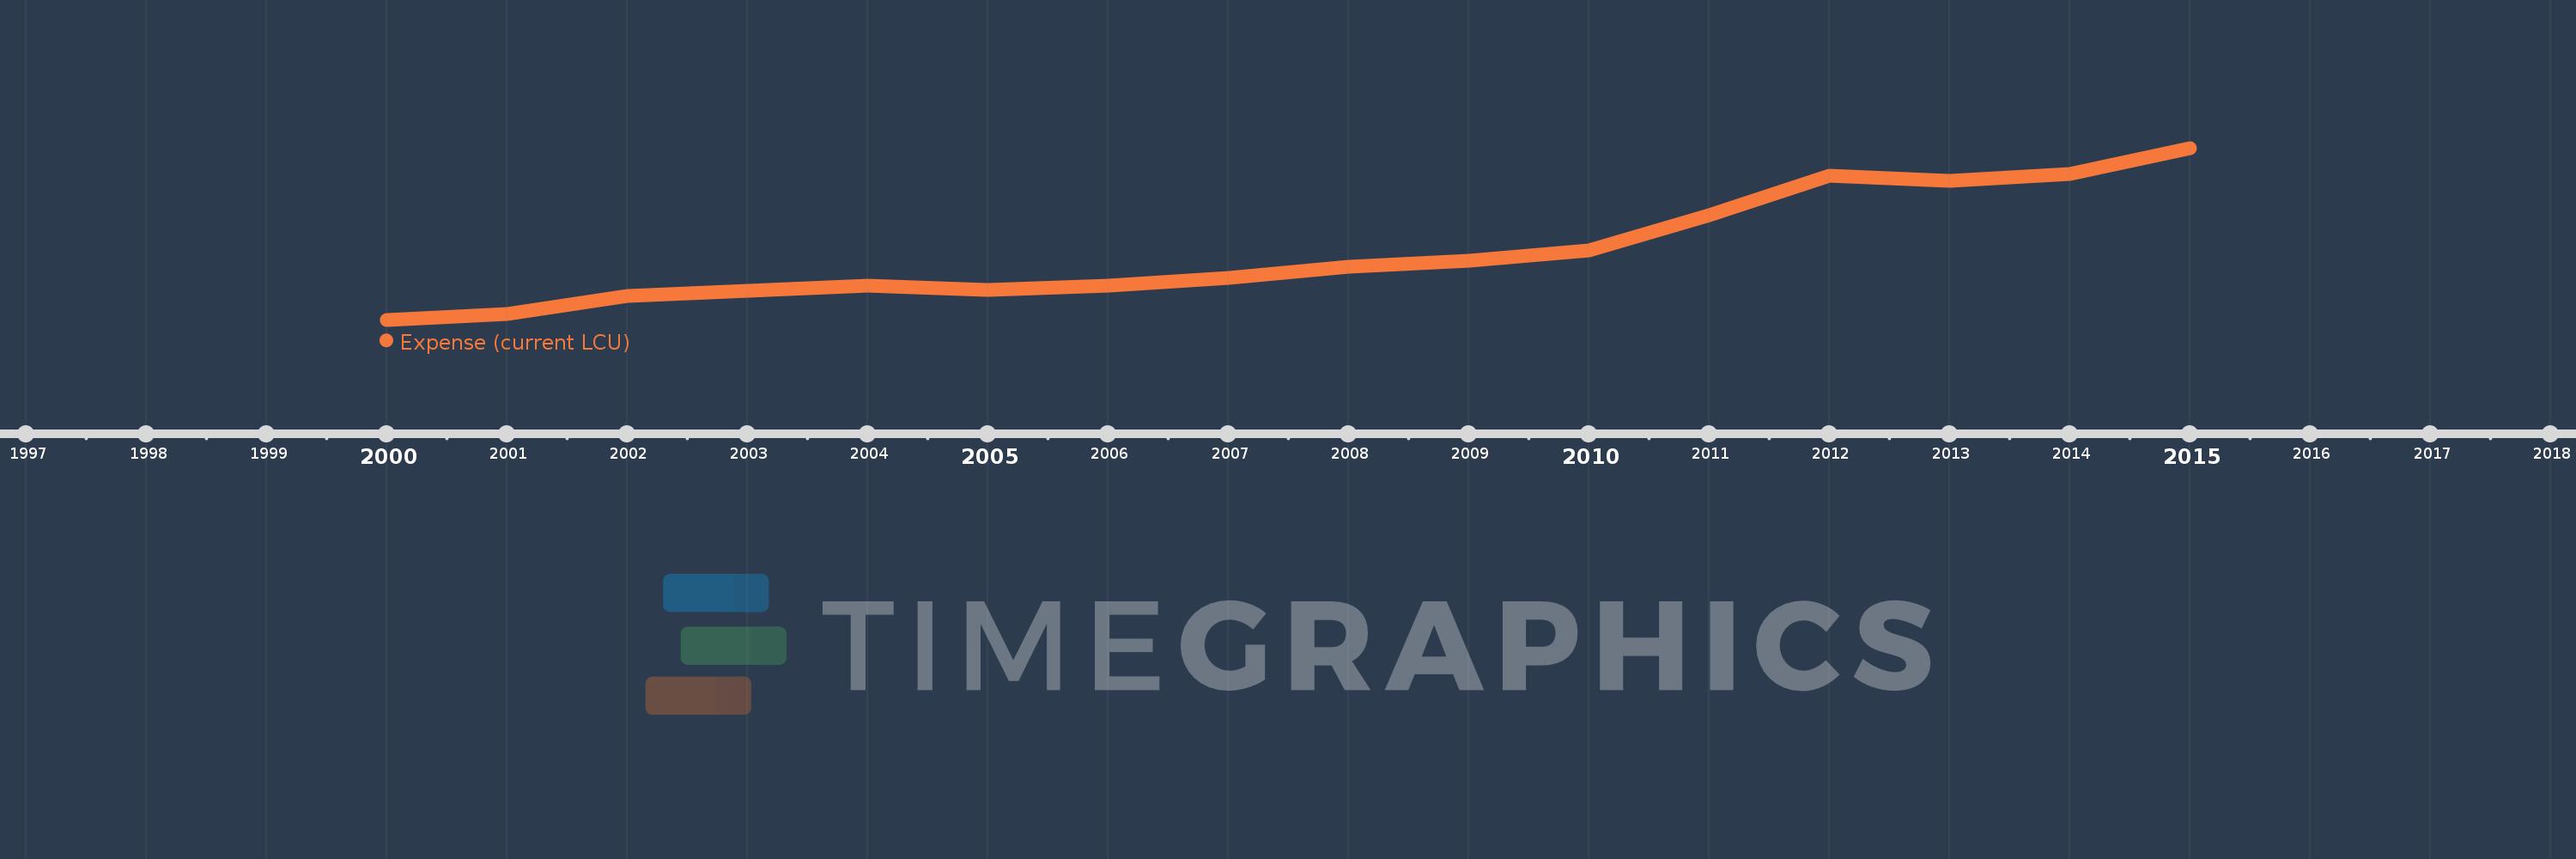
Questa scala temporale mostra un grafico dal 2000 anno al 2015 anno. Uganda. I dati fino ad 1999 anno non disponibili. Il numero di osservazioni attuali secondo i date: 16.
La fonte (nome):
Indicatori dello sviluppo mondiale
La fonte (organizzazione):
International Monetary Fund, Government Finance Statistics Yearbook and data files.
Categorie:
Public Sector
sono stati aggiornati
23 apr 2017 anni
Indicatori delle variazioni dei valori per anni
In media:
4.124 Trln
Minima:
1.216 Trln
1 gen 2000 anni
Massimo:
8.583 Trln
1 gen 2015 anni
Alla data di osservazione
Valore
Variazione assoluta
La variazione rispetto al valore precedente
1 gen 2000 anni
1.216 Trln
+1.216 Trln
0.0%
1 gen 2001 anni
1.454 Trln
+237.391 Mlrd
19.51%
1 gen 2002 anni
2.22 Trln
+765.788 Mlrd
52.67%
1 gen 2003 anni
2.474 Trln
+254.1 Mlrd
11.45%
1 gen 2004 anni
2.688 Trln
+213.958 Mlrd
8.65%
1 gen 2005 anni
2.493 Trln
-194.939 Mlrd
-7.25%
1 gen 2006 anni
2.674 Trln
+181.046 Mlrd
7.26%
1 gen 2007 anni
3.02 Trln
+346.038 Mlrd
12.94%
1 gen 2008 anni
3.488 Trln
+467.827 Mlrd
15.49%
1 gen 2009 anni
3.76 Trln
+272.14 Mlrd
7.8%
1 gen 2010 anni
4.174 Trln
+413.795 Mlrd
11.01%
1 gen 2011 anni
5.694 Trln
+1.521 Trln
36.43%
1 gen 2012 anni
7.409 Trln
+1.715 Trln
30.11%
1 gen 2013 anni
7.177 Trln
-231.853 Mlrd
-3.13%
1 gen 2014 anni
7.454 Trln
+277.249 Mlrd
3.86%
1 gen 2015 anni
8.583 Trln
+1.129 Trln
15.14%
Classificazione dei paesi secondo i statistiche attuali per anni
