Download Queste statistiche in altri paesi:
Linea del tempo:
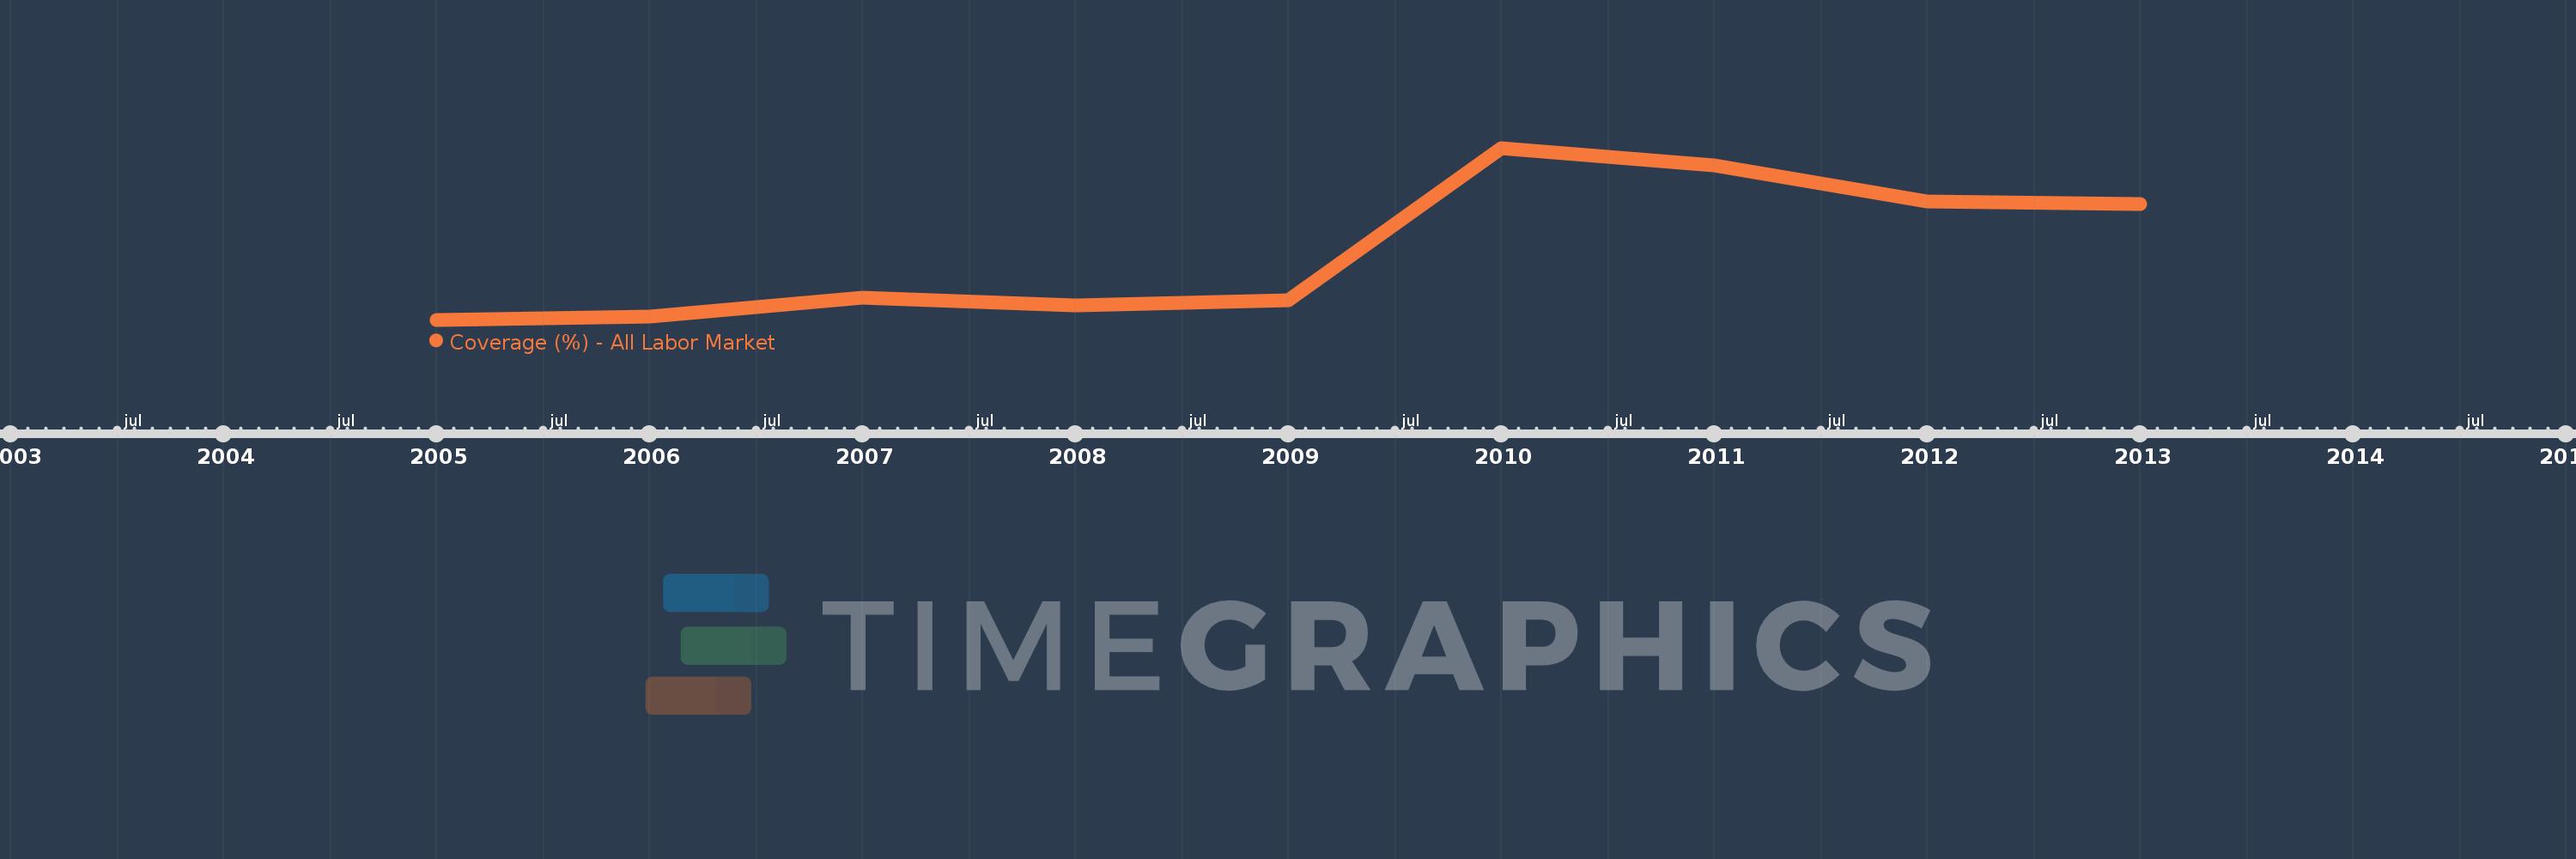
Questa scala temporale mostra un grafico dal 2005 anno al 2013 anno. Turkey. I dati fino ad 2004 anno non disponibili. Il numero di osservazioni attuali secondo i date: 9.
La fonte (nome):
Indicatori dello sviluppo mondiale
La fonte (organizzazione):
The Atlas of Social Protection: Indicators of Resilience and Equity (ASPIRE)
Categorie:
Social Protection & Labor
sono stati aggiornati
23 apr 2017 anni
Indicatori delle variazioni dei valori per anni
Minima:
0.223
1 gen 2005 anni
Massimo:
1.139
1 gen 2010 anni
Alla data di osservazione
Valore
Variazione assoluta
La variazione rispetto al valore precedente
1 gen 2005 anni
0.223
+0.223
0.0%
1 gen 2006 anni
0.238
+0.015
6.85%
1 gen 2007 anni
0.341
+0.103
43.15%
1 gen 2008 anni
0.301
-0.04
-11.8%
1 gen 2009 anni
0.326
+0.026
8.51%
1 gen 2010 anni
1.139
+0.813
249.02%
1 gen 2011 anni
1.045
-0.095
-8.33%
1 gen 2012 anni
0.853
-0.191
-18.31%
1 gen 2013 anni
0.841
-0.012
-1.46%
Classificazione dei paesi secondo i statistiche attuali per anni
