Download Queste statistiche in altri paesi:
Linea del tempo:
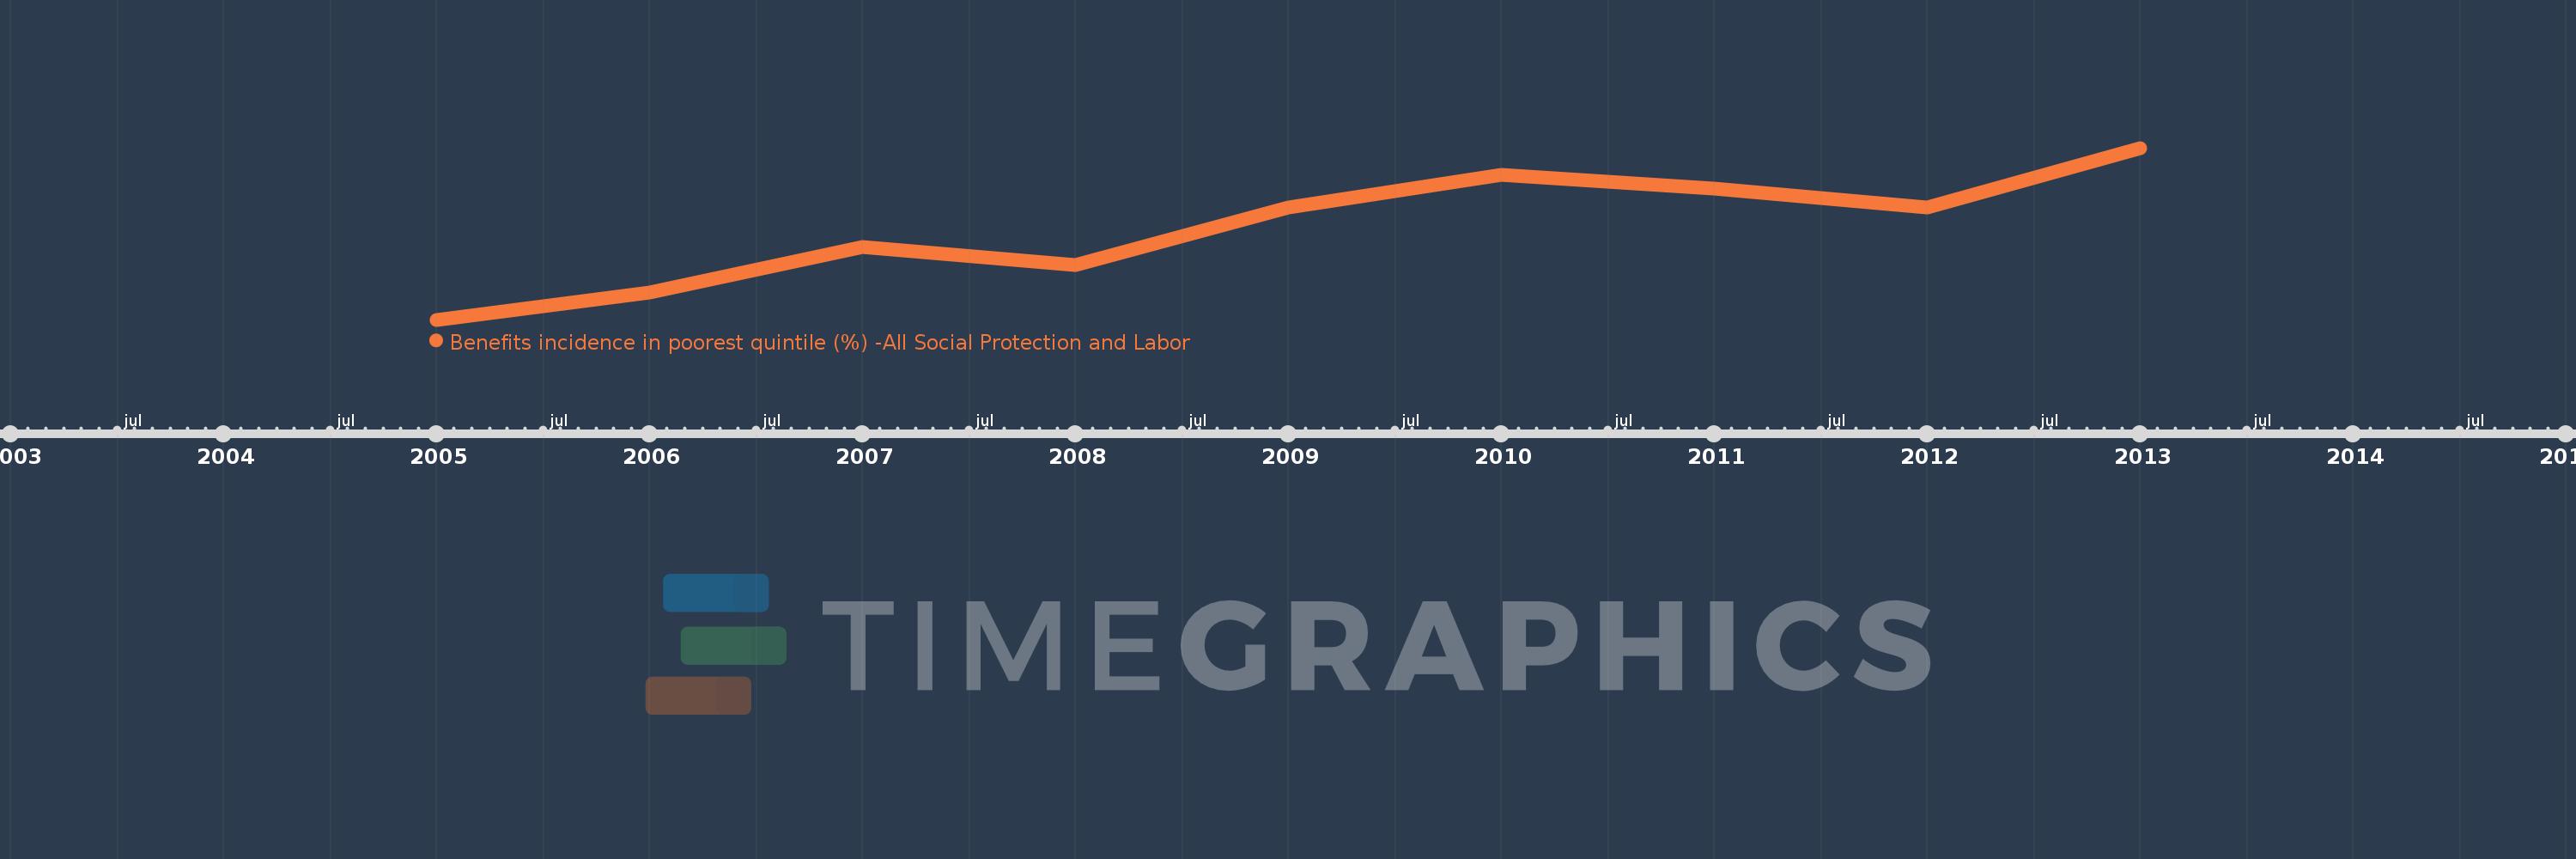
Questa scala temporale mostra un grafico dal 2005 anno al 2013 anno. Turkey. I dati fino ad 2004 anno non disponibili. Il numero di osservazioni attuali secondo i date: 9.
La fonte (nome):
Indicatori dello sviluppo mondiale
La fonte (organizzazione):
The Atlas of Social Protection: Indicators of Resilience and Equity (ASPIRE)
Categorie:
Social Protection & Labor
sono stati aggiornati
23 apr 2017 anni
Indicatori delle variazioni dei valori per anni
Minima:
3.136
1 gen 2005 anni
Massimo:
6.346
1 gen 2013 anni
Alla data di osservazione
Valore
Variazione assoluta
La variazione rispetto al valore precedente
1 gen 2005 anni
3.136
+3.136
0.0%
1 gen 2006 anni
3.647
+0.511
16.3%
1 gen 2007 anni
4.503
+0.856
23.48%
1 gen 2008 anni
4.154
-0.349
-7.76%
1 gen 2009 anni
5.237
+1.083
26.08%
1 gen 2010 anni
5.851
+0.614
11.71%
1 gen 2011 anni
5.582
-0.268
-4.59%
1 gen 2012 anni
5.227
-0.356
-6.37%
1 gen 2013 anni
6.346
+1.119
21.42%
Classificazione dei paesi secondo i statistiche attuali per anni
