29
/it/
it
AIzaSyAYiBZKx7MnpbEhh9jyipgxe19OcubqV5w
April 1, 2024
266915
Trinidad and Tobago
TTO
true
2
1
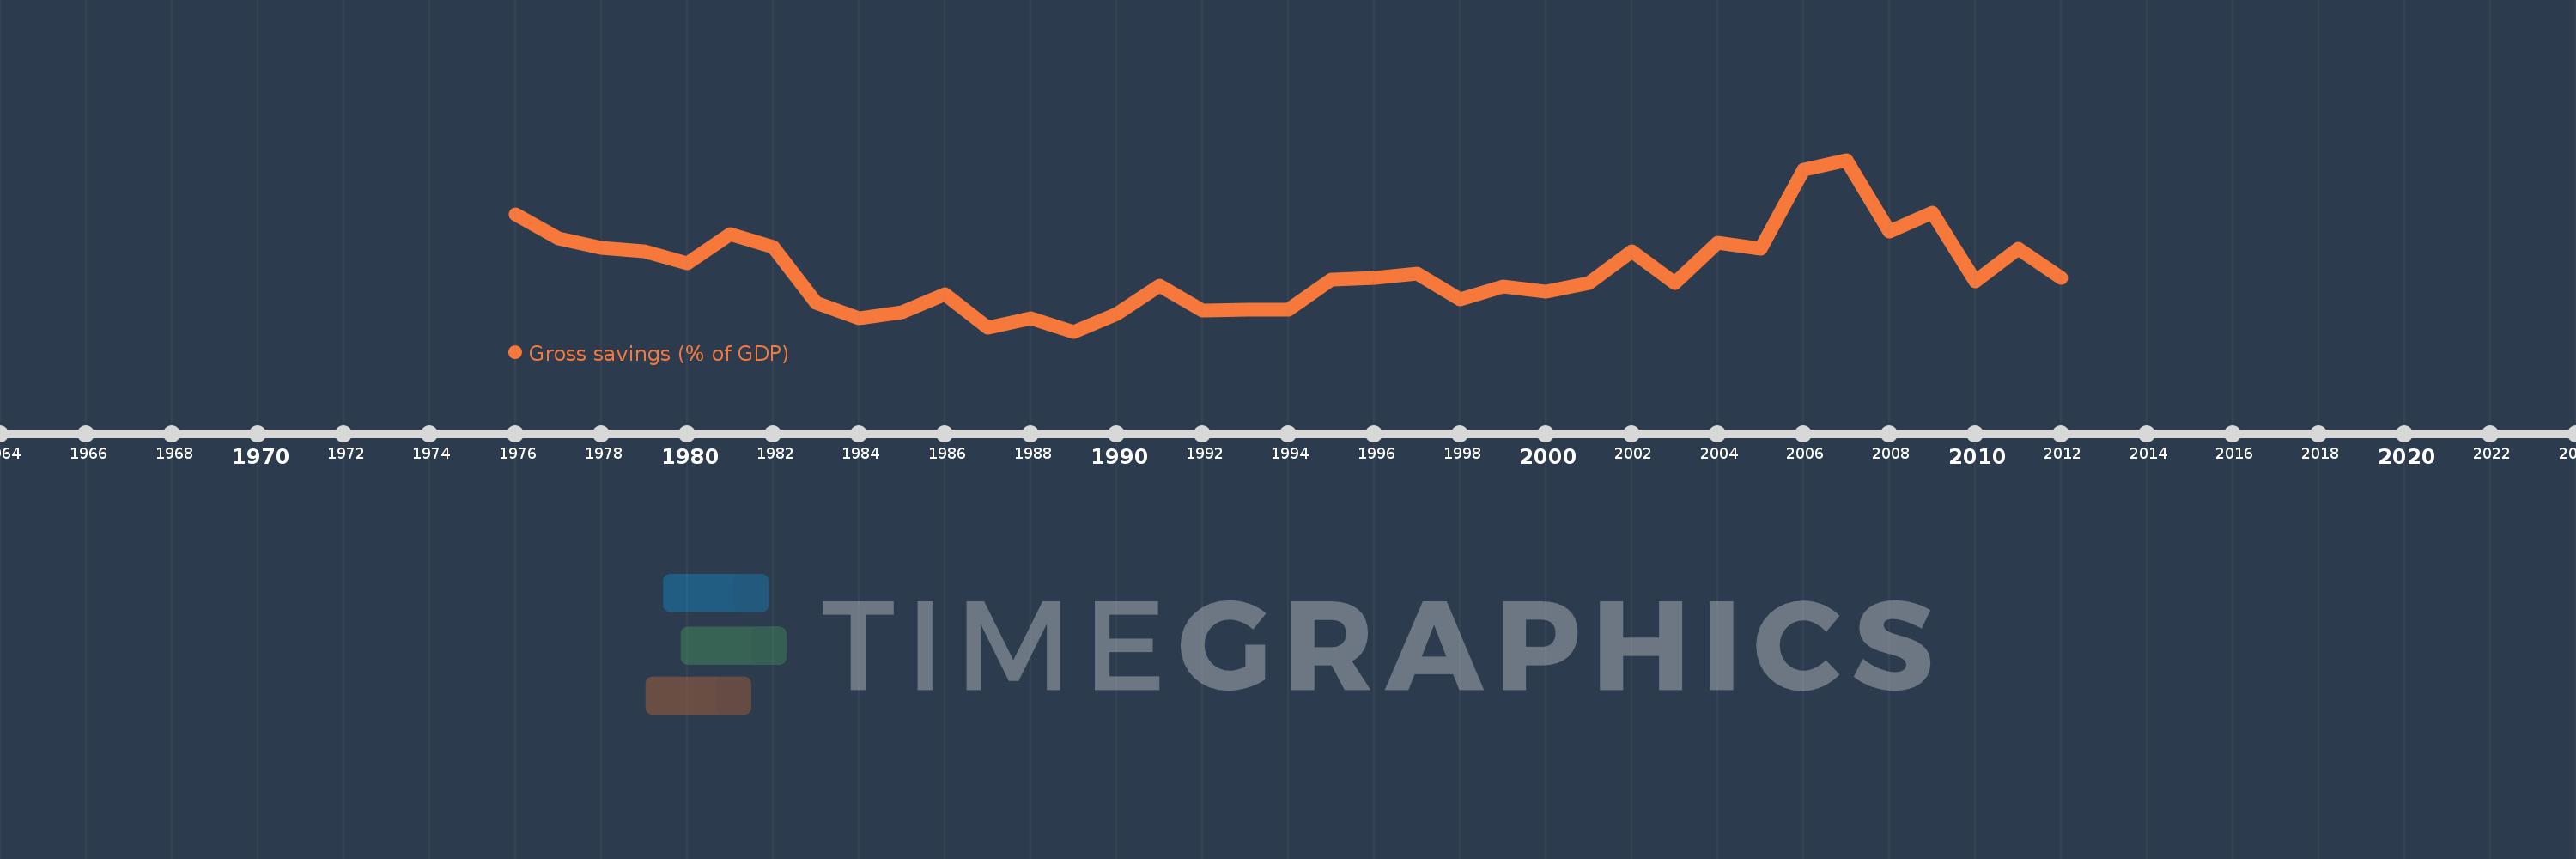
Gross savings (% of GDP)
2012,2011,2010,2009,2008,2007,2006,2005,2004,2003,2002,2001,2000,1999,1998,1997,1996,1995,1994,1993,1992,1991,1990,1989,1988,1987,1986,1985,1984,1983,1982,1981,1980,1979,1978,1977,1976
Queste statistiche in altri paesi:
AfghanistanAlbaniaAlgeriaAngolaAntigua and BarbudaArab WorldArgentinaArmeniaAustraliaAustriaAzerbaijanBahamas, TheBahrainBangladeshBarbadosBelarusBelgiumBelizeBeninBermudaBhutanBoliviaBosnia and HerzegovinaBotswanaBrazilBrunei DarussalamBulgariaBurkina FasoBurundiCabo VerdeCambodiaCameroonCanadaCaribbean small statesCentral African RepublicCentral Europe and the BalticsChadChileChinaColombiaComorosCongo, Dem. Rep.Congo, Rep.Costa RicaCote d'IvoireCroatiaCyprusCzech RepublicDenmarkDjiboutiDominicaDominican RepublicEarly-demographic dividendEast Asia & PacificEast Asia & Pacific (excluding high income)East Asia & Pacific (IDA & IBRD countries)EcuadorEgypt, Arab Rep.El SalvadorEquatorial GuineaEritreaEstoniaEthiopiaEuro areaEurope & Central AsiaEurope & Central Asia (excluding high income)Europe & Central Asia (IDA & IBRD countries)European UnionFaroe IslandsFijiFinlandFragile and conflict affected situationsFranceGabonGambia, TheGeorgiaGermanyGhanaGreeceGrenadaGuatemalaGuineaGuinea-BissauGuyanaHaitiHeavily indebted poor countries (HIPC)High incomeHondurasHong Kong SAR, ChinaHungaryIBRD onlyIcelandIDA & IBRD totalIDA blendIDA onlyIDA totalIndiaIndonesiaIran, Islamic Rep.IraqIrelandIsraelItalyJamaicaJapanJordanKazakhstanKenyaKiribatiKorea, Rep.KosovoKuwaitKyrgyz RepublicLao PDRLate-demographic dividendLatin America & Caribbean Latin America & Caribbean (excluding high income)Latin America & the Caribbean (IDA & IBRD countries)LatviaLeast developed countries: UN classificationLebanonLesothoLiberiaLibyaLithuaniaLow & middle incomeLow incomeLower middle incomeLuxembourgMacao SAR, ChinaMacedonia, FYRMadagascarMalawiMalaysiaMaldivesMaliMaltaMauritaniaMauritiusMexicoMiddle East & North AfricaMiddle East & North Africa (excluding high income)Middle East & North Africa (IDA & IBRD countries)Middle incomeMoldovaMongoliaMontenegroMoroccoMozambiqueNamibiaNepalNetherlandsNew ZealandNicaraguaNigerNigeriaNorth AmericaNorwayOECD membersOmanOther small statesPacific island small statesPakistanPanamaPapua New GuineaParaguayPeruPhilippinesPolandPortugalPost-demographic dividendPre-demographic dividendQatarRomaniaRussian FederationRwandaSaudi ArabiaSenegalSerbiaSeychellesSierra LeoneSingaporeSlovak RepublicSloveniaSmall statesSolomon IslandsSouth AfricaSouth AsiaSouth Asia (IDA & IBRD)South SudanSpainSri LankaSt. Kitts and NevisSt. LuciaSt. Vincent and the GrenadinesSub-Saharan Africa Sub-Saharan Africa (excluding high income)Sub-Saharan Africa (IDA & IBRD countries)SudanSurinameSwazilandSwedenSwitzerlandSyrian Arab RepublicTajikistanTanzaniaThailandTimor-LesteTogoTongaTrinidad and TobagoTunisiaTurkeyUgandaUkraineUnited KingdomUnited StatesUpper middle incomeUruguayVanuatuVenezuela, RBVietnamWest Bank and GazaWorldYemen, Rep.ZambiaZimbabwe Linea del tempo:
Questa scala temporale mostra un grafico dal 1976 anno al 2012 anno. Trinidad and Tobago. I dati fino ad 1975 anno non disponibili. Il numero di osservazioni attuali secondo i date: 37.
La fonte (nome):
Indicatori dello sviluppo mondiale
La fonte (organizzazione):
World Bank national accounts data, and OECD National Accounts data files.
Categorie:
Economy & Growth
sono stati aggiornati
23 apr 2017 anni
Indicatori delle variazioni dei valori per anni
Minima:
10.915
1 gen 1989 anni
Massimo:
55.254
1 gen 2007 anni
Alla data di osservazione
Valore
Variazione assoluta
La variazione rispetto al valore precedente
1 gen 1976 anni
41.201
+41.201
0.0%
1 gen 1977 anni
34.928
-6.273
-15.23%
1 gen 1978 anni
32.43
-2.498
-7.15%
1 gen 1979 anni
31.685
-0.746
-2.3%
1 gen 1980 anni
28.624
-3.06
-9.66%
1 gen 1981 anni
36.169
+7.545
26.36%
1 gen 1982 anni
32.754
-3.416
-9.44%
1 gen 1983 anni
18.417
-14.337
-43.77%
1 gen 1984 anni
14.41
-4.006
-21.75%
1 gen 1985 anni
15.937
+1.527
10.59%
1 gen 1986 anni
20.637
+4.7
29.49%
1 gen 1987 anni
11.87
-8.767
-42.48%
1 gen 1988 anni
14.4
+2.53
21.31%
1 gen 1989 anni
10.915
-3.484
-24.2%
1 gen 1990 anni
15.494
+4.579
41.95%
1 gen 1991 anni
22.692
+7.198
46.45%
1 gen 1992 anni
16.369
-6.323
-27.87%
1 gen 1993 anni
16.557
+0.188
1.15%
1 gen 1994 anni
16.586
+0.029
0.17%
1 gen 1995 anni
24.371
+7.786
46.94%
1 gen 1996 anni
24.673
+0.302
1.24%
1 gen 1997 anni
25.88
+1.207
4.89%
1 gen 1998 anni
19.177
-6.703
-25.9%
1 gen 1999 anni
22.488
+3.311
17.27%
1 gen 2000 anni
21.217
-1.271
-5.65%
1 gen 2001 anni
23.462
+2.245
10.58%
1 gen 2002 anni
31.752
+8.29
35.33%
1 gen 2003 anni
23.474
-8.278
-26.07%
1 gen 2004 anni
33.905
+10.431
44.44%
1 gen 2005 anni
32.271
-1.634
-4.82%
1 gen 2006 anni
52.689
+20.419
63.27%
1 gen 2007 anni
55.254
+2.565
4.87%
1 gen 2008 anni
36.772
-18.482
-33.45%
1 gen 2009 anni
41.572
+4.8
13.05%
1 gen 2010 anni
23.985
-17.587
-42.31%
1 gen 2011 anni
32.231
+8.247
34.38%
1 gen 2012 anni
24.819
-7.412
-23.0%
Classificazione dei paesi secondo i statistiche attuali per anni


Commenti: