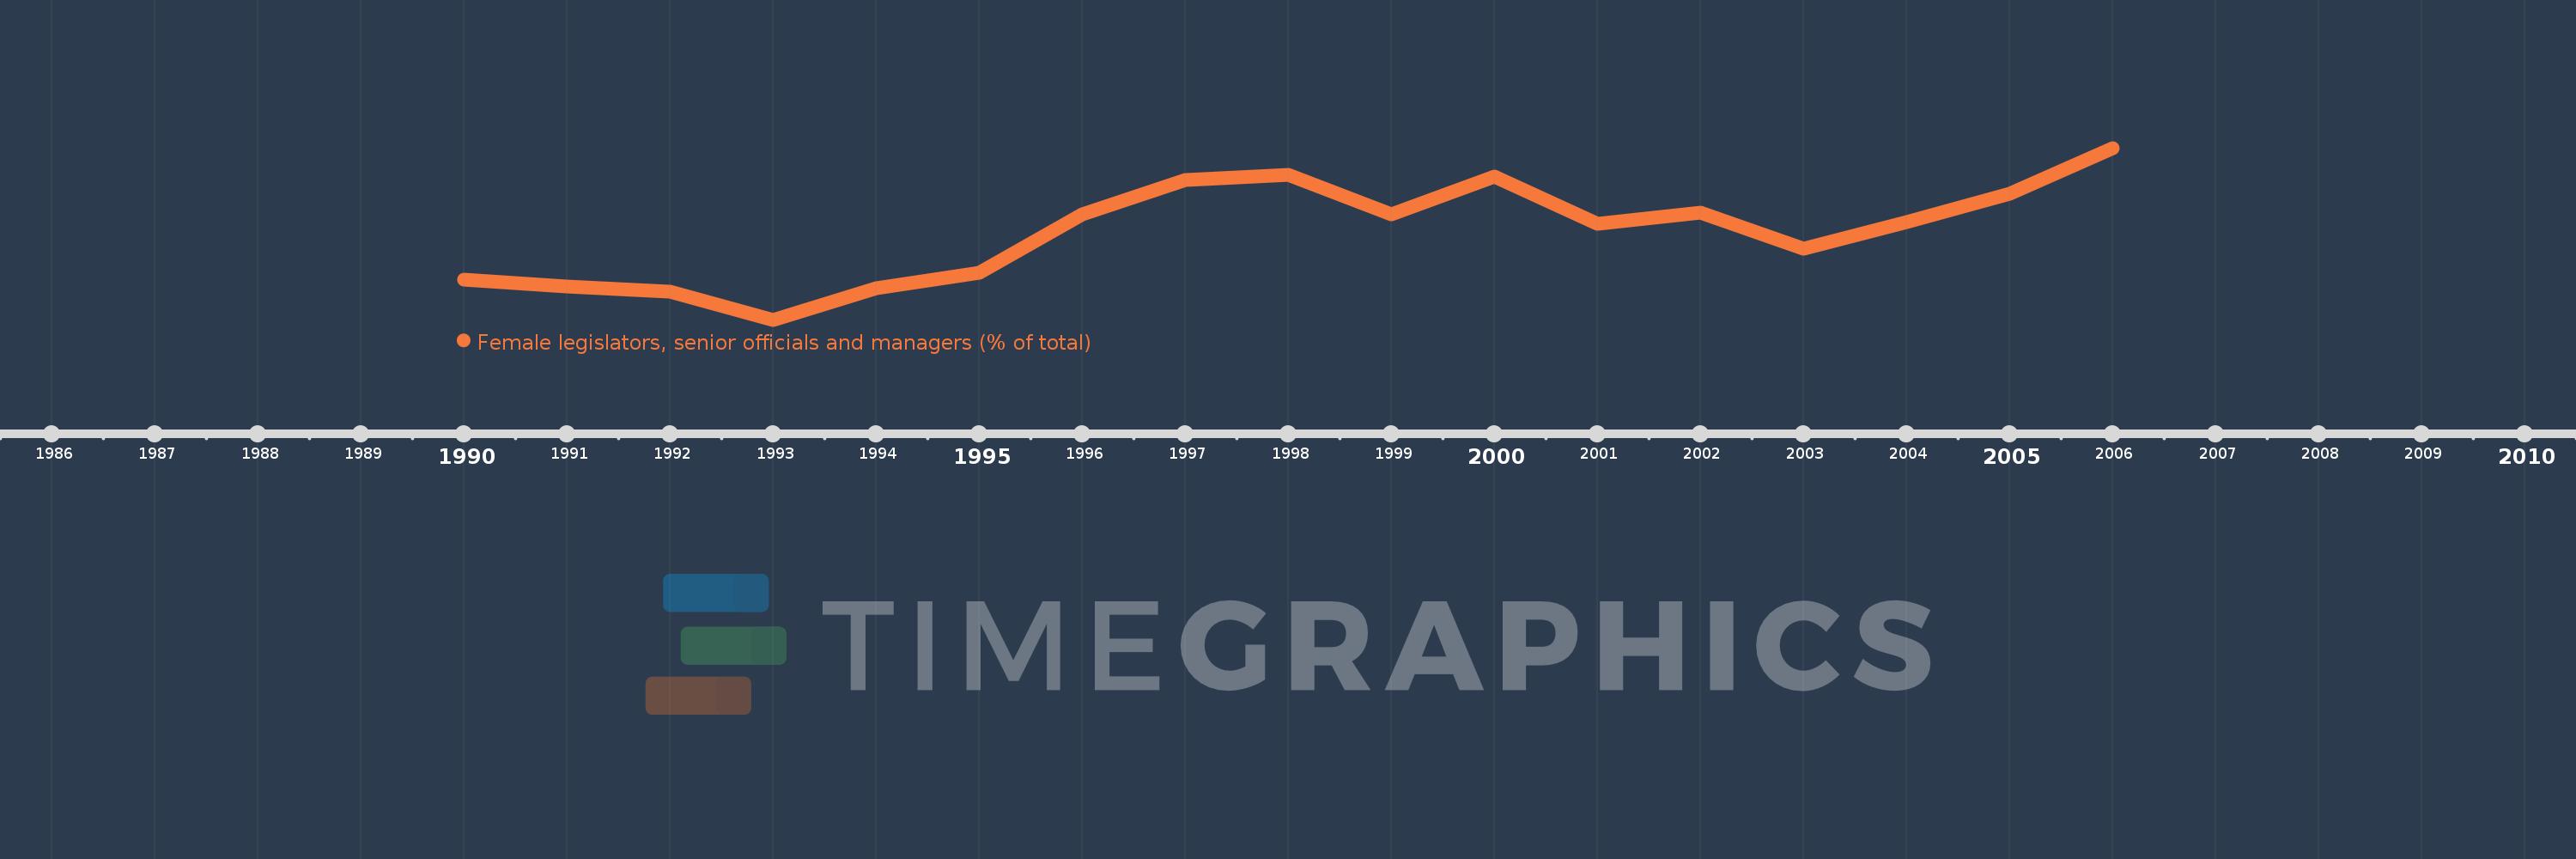
Questa scala temporale mostra un grafico dal 1990 anno al 2006 anno. Trinidad and Tobago. I dati fino ad 1989 anno non disponibili. Il numero di osservazioni attuali secondo i date: 17.
La fonte (nome):
Indicatori dello sviluppo mondiale
La fonte (organizzazione):
ILO Key Indicators of the Labour Market (KILM).
Categorie:
Public Sector, Gender
sono stati aggiornati
23 apr 2017 anni
Indicatori delle variazioni dei valori per anni
In media:
38.752
Minima:
33.835
1 gen 1993 anni
Massimo:
43.478
1 gen 2006 anni
Alla data di osservazione
Valore
Variazione assoluta
La variazione rispetto al valore precedente
1 gen 1990 anni
36.101
+36.101
0.0%
1 gen 1991 anni
35.686
-0.415
-1.15%
1 gen 1992 anni
35.417
-0.27
-0.76%
1 gen 1993 anni
33.835
-1.582
-4.47%
1 gen 1994 anni
35.593
+1.759
5.2%
1 gen 1995 anni
36.496
+0.903
2.54%
1 gen 1996 anni
39.735
+3.239
8.87%
1 gen 1997 anni
41.695
+1.96
4.93%
1 gen 1998 anni
41.987
+0.292
0.7%
1 gen 1999 anni
39.739
-2.248
-5.35%
1 gen 2000 anni
41.867
+2.128
5.36%
1 gen 2001 anni
39.227
-2.641
-6.31%
1 gen 2002 anni
39.846
+0.619
1.58%
1 gen 2003 anni
37.811
-2.035
-5.11%
1 gen 2004 anni
39.34
+1.529
4.04%
1 gen 2005 anni
40.93
+1.59
4.04%
1 gen 2006 anni
43.478
+2.548
6.23%
Classificazione dei paesi secondo i statistiche attuali per anni
