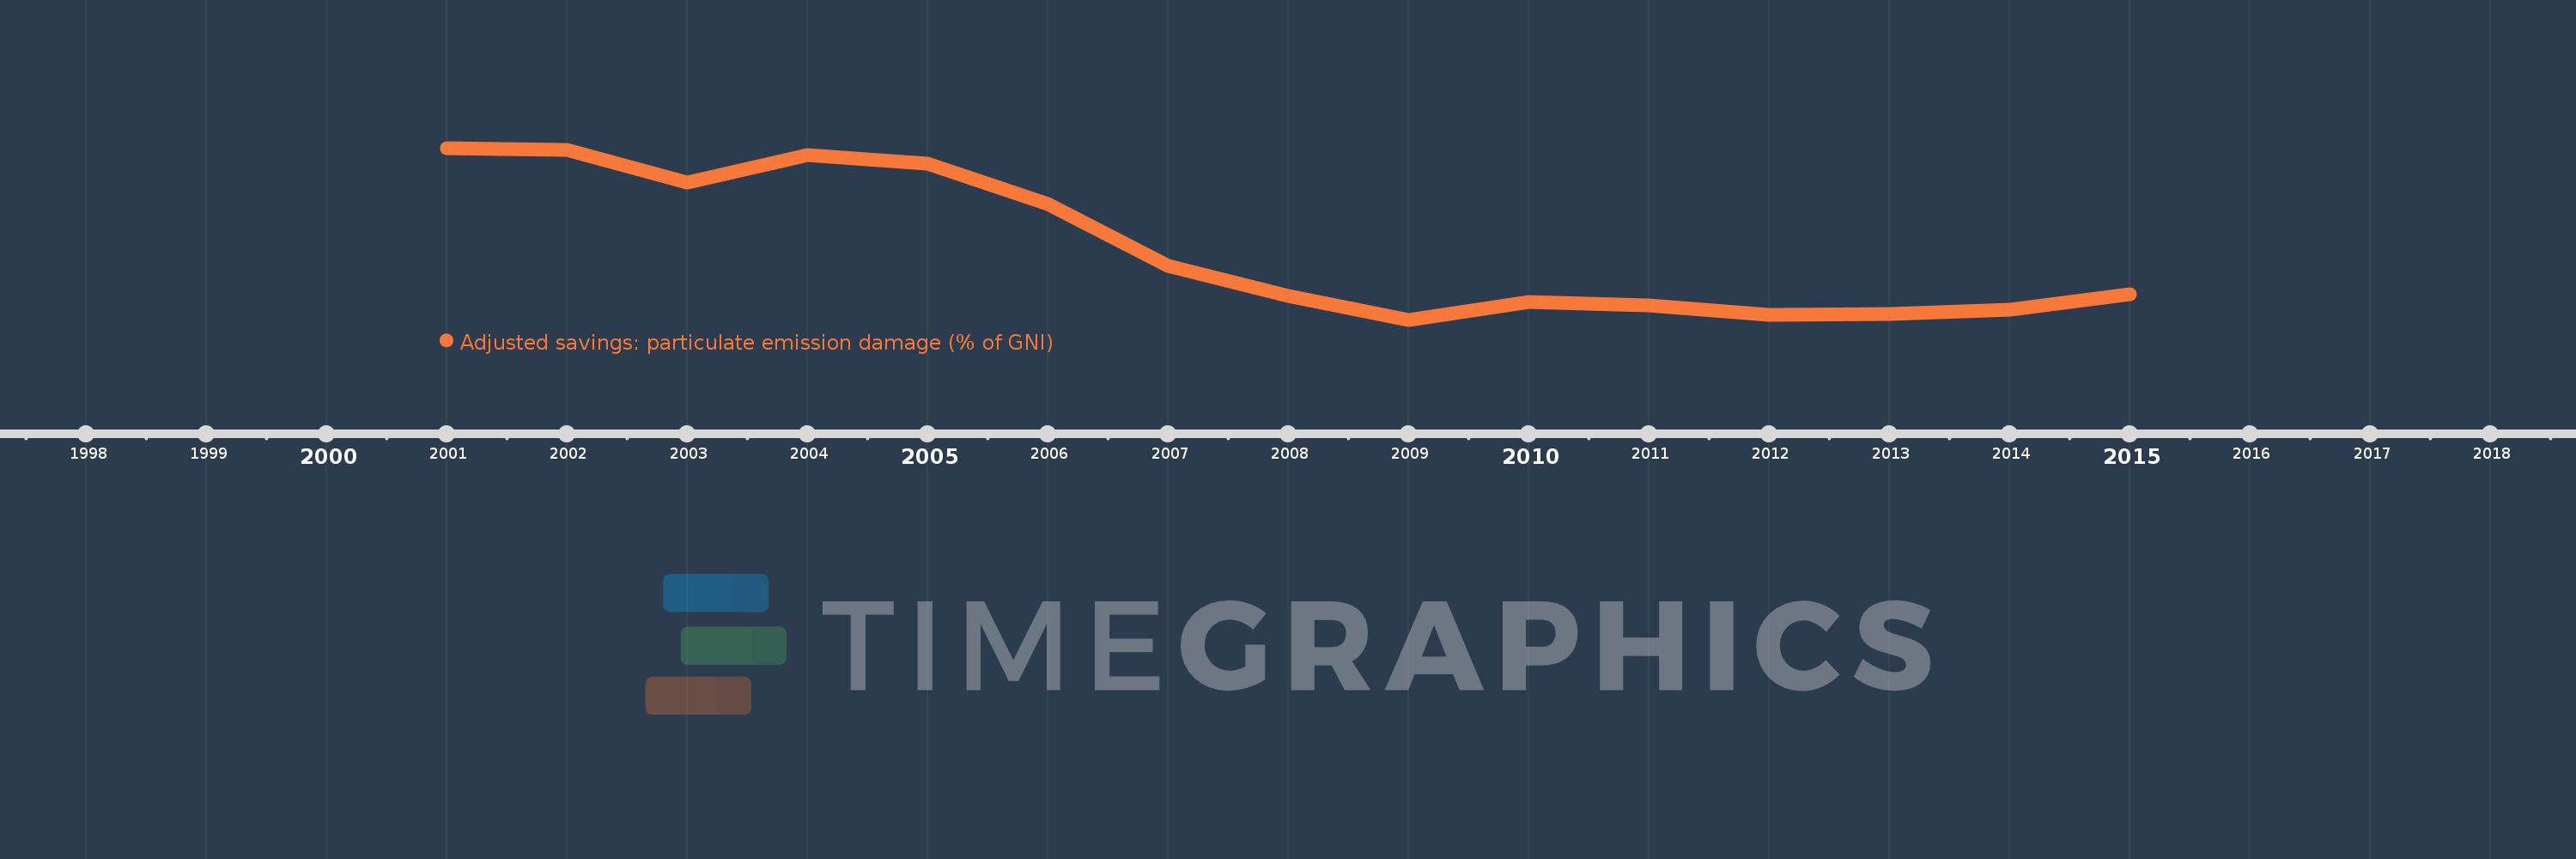
Questa scala temporale mostra un grafico dal 2001 anno al 2015 anno. Timor-Leste. I dati fino ad 2000 anno non disponibili. Il numero di osservazioni attuali secondo i date: 15.
La fonte (nome):
Indicatori dello sviluppo mondiale
La fonte (organizzazione):
Data on health impacts from exposure to ambient PM2.5 pollution and household air pollution are from the Global Burden of Disease 2010 study. Data are provided by the Institute for Health Metrics and Evaluation at the University of Washington.
Categorie:
Economy & Growth, Environment
sono stati aggiornati
23 apr 2017 anni
Indicatori delle variazioni dei valori per anni
In media:
0.634
Minima:
0.244
1 gen 2009 anni
Massimo:
1.182
1 gen 2001 anni
Alla data di osservazione
Valore
Variazione assoluta
La variazione rispetto al valore precedente
1 gen 2001 anni
1.182
+1.182
0.0%
1 gen 2002 anni
1.17
-0.012
-1.04%
1 gen 2003 anni
0.994
-0.175
-14.97%
1 gen 2004 anni
1.145
+0.151
15.14%
1 gen 2005 anni
1.095
-0.05
-4.33%
1 gen 2006 anni
0.874
-0.222
-20.26%
1 gen 2007 anni
0.538
-0.336
-38.46%
1 gen 2008 anni
0.374
-0.163
-30.37%
1 gen 2009 anni
0.244
-0.13
-34.75%
1 gen 2010 anni
0.342
+0.097
39.86%
1 gen 2011 anni
0.321
-0.021
-6.13%
1 gen 2012 anni
0.271
-0.049
-15.4%
1 gen 2013 anni
0.274
+0.003
1.16%
1 gen 2014 anni
0.3
+0.025
9.26%
1 gen 2015 anni
0.383
+0.084
27.87%
Classificazione dei paesi secondo i statistiche attuali per anni
