29
/it/
it
AIzaSyAYiBZKx7MnpbEhh9jyipgxe19OcubqV5w
April 1, 2024
261829
Thailand
THA
true
2
1
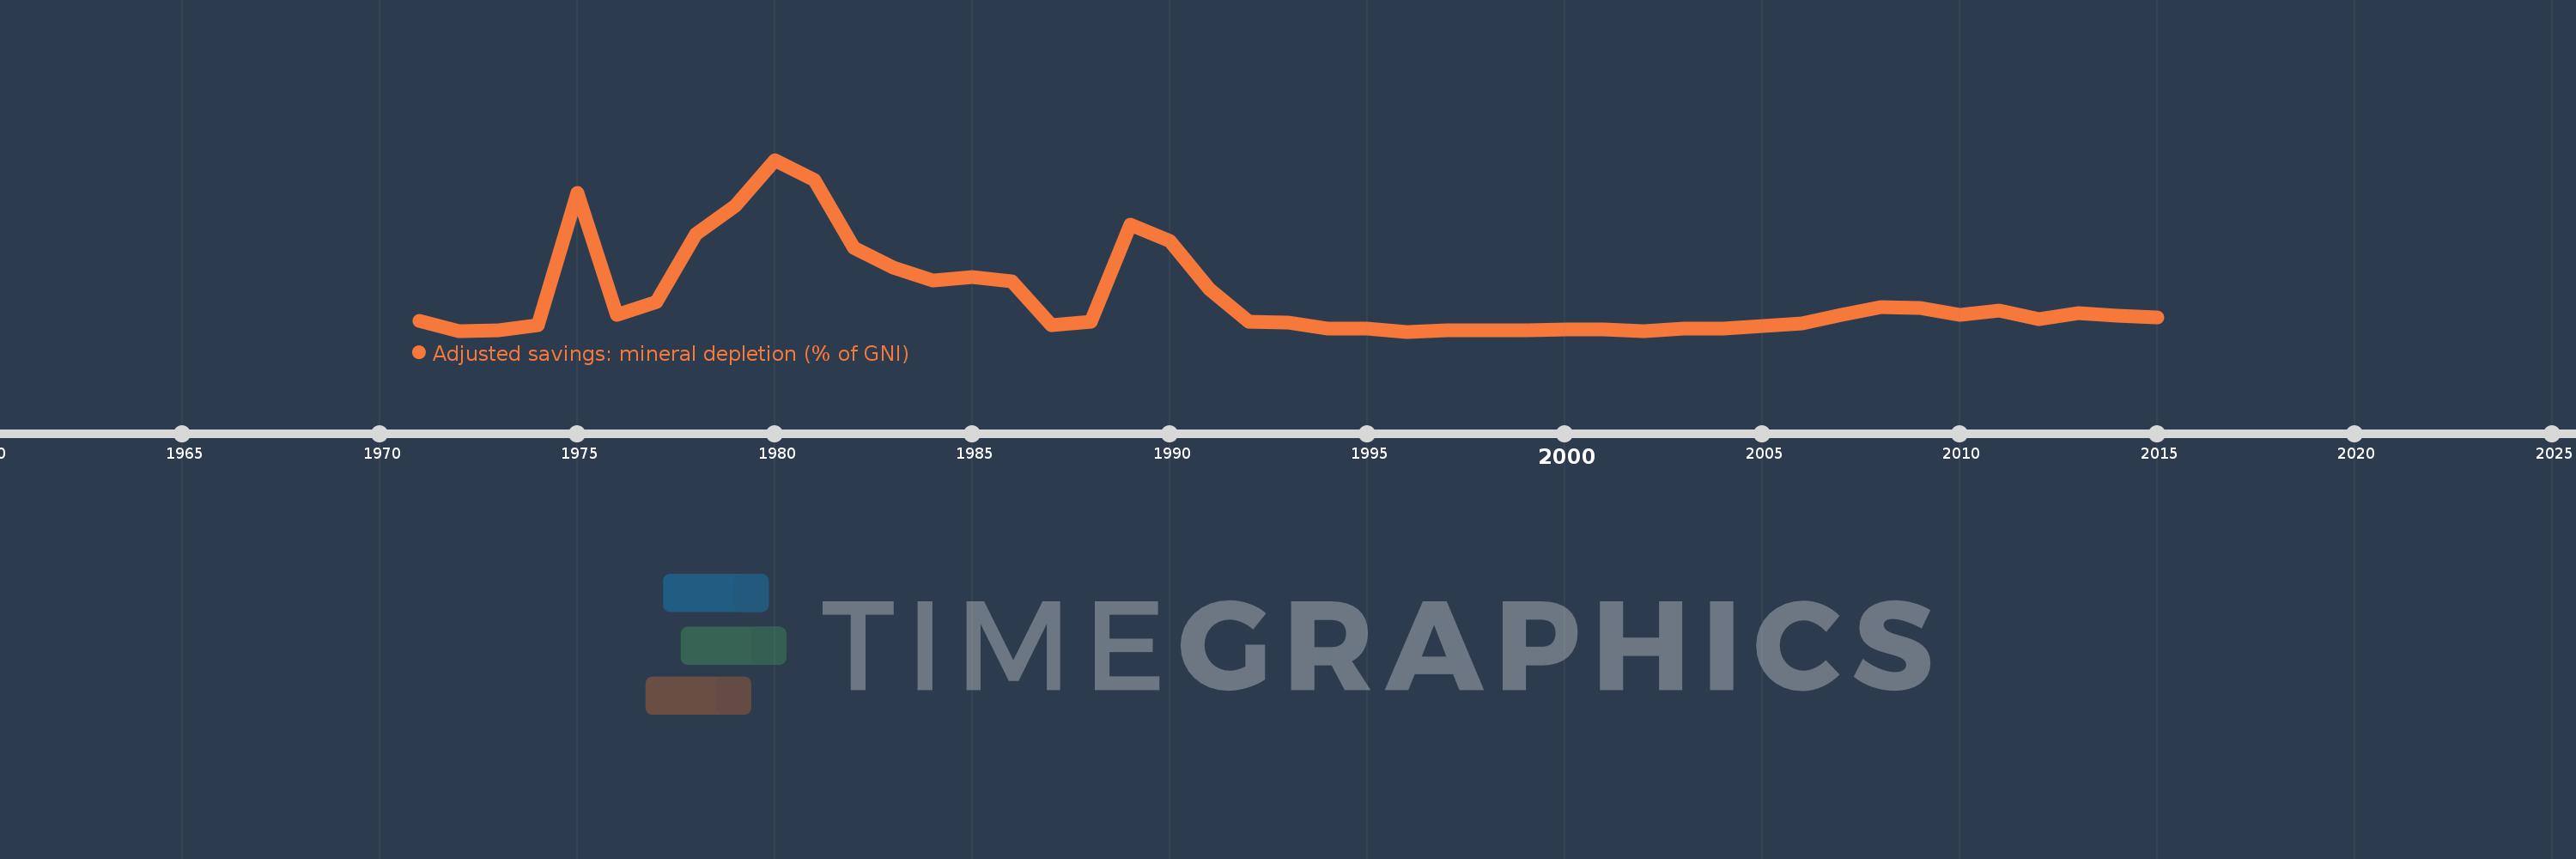
Adjusted savings: mineral depletion (% of GNI)
2015,2014,2013,2012,2011,2010,2009,2008,2007,2006,2005,2004,2003,2002,2001,2000,1999,1998,1997,1996,1995,1994,1993,1992,1991,1990,1989,1988,1987,1986,1985,1984,1983,1982,1981,1980,1979,1978,1977,1976,1975,1974,1973,1972,1971
Queste statistiche in altri paesi:
AfghanistanAlbaniaAlgeriaAmerican SamoaAndorraAngolaAntigua and BarbudaArab WorldArgentinaArmeniaAustraliaAustriaAzerbaijanBahamas, TheBahrainBangladeshBarbadosBelarusBelgiumBelizeBeninBermudaBhutanBoliviaBosnia and HerzegovinaBotswanaBrazilBrunei DarussalamBulgariaBurkina FasoBurundiCabo VerdeCambodiaCameroonCanadaCaribbean small statesCentral African RepublicCentral Europe and the BalticsChadChannel IslandsChileChinaColombiaComorosCongo, Dem. Rep.Congo, Rep.Costa RicaCote d'IvoireCroatiaCubaCyprusCzech RepublicDenmarkDjiboutiDominicaDominican RepublicEarly-demographic dividendEast Asia & PacificEast Asia & Pacific (excluding high income)East Asia & Pacific (IDA & IBRD countries)EcuadorEgypt, Arab Rep.El SalvadorEquatorial GuineaEritreaEstoniaEthiopiaEuro areaEurope & Central AsiaEurope & Central Asia (excluding high income)Europe & Central Asia (IDA & IBRD countries)European UnionFaroe IslandsFijiFinlandFragile and conflict affected situationsFranceFrench PolynesiaGabonGambia, TheGeorgiaGermanyGhanaGreeceGreenlandGrenadaGuatemalaGuineaGuinea-BissauGuyanaHaitiHeavily indebted poor countries (HIPC)High incomeHondurasHong Kong SAR, ChinaHungaryIBRD onlyIcelandIDA & IBRD totalIDA blendIDA onlyIDA totalIndiaIndonesiaIran, Islamic Rep.IraqIrelandIsle of ManIsraelItalyJamaicaJapanJordanKazakhstanKenyaKiribatiKorea, Rep.KosovoKuwaitKyrgyz RepublicLao PDRLate-demographic dividendLatin America & Caribbean Latin America & Caribbean (excluding high income)Latin America & the Caribbean (IDA & IBRD countries)LatviaLeast developed countries: UN classificationLebanonLesothoLiberiaLibyaLiechtensteinLithuaniaLow & middle incomeLow incomeLower middle incomeLuxembourgMacao SAR, ChinaMacedonia, FYRMadagascarMalawiMalaysiaMaldivesMaliMaltaMarshall IslandsMauritaniaMauritiusMexicoMicronesia, Fed. Sts.Middle East & North AfricaMiddle East & North Africa (excluding high income)Middle East & North Africa (IDA & IBRD countries)Middle incomeMoldovaMonacoMongoliaMontenegroMoroccoMozambiqueMyanmarNamibiaNepalNetherlandsNew CaledoniaNew ZealandNicaraguaNigerNigeriaNorth AmericaNorwayOECD membersOmanOther small statesPacific island small statesPakistanPalauPanamaPapua New GuineaParaguayPeruPhilippinesPolandPortugalPost-demographic dividendPre-demographic dividendPuerto RicoQatarRomaniaRussian FederationRwandaSamoaSan MarinoSao Tome and PrincipeSaudi ArabiaSenegalSerbiaSeychellesSierra LeoneSingaporeSlovak RepublicSloveniaSmall statesSolomon IslandsSomaliaSouth AfricaSouth AsiaSouth Asia (IDA & IBRD)South SudanSpainSri LankaSt. Kitts and NevisSt. LuciaSt. Vincent and the GrenadinesSub-Saharan Africa Sub-Saharan Africa (excluding high income)Sub-Saharan Africa (IDA & IBRD countries)SudanSurinameSwazilandSwedenSwitzerlandSyrian Arab RepublicTajikistanTanzaniaThailandTimor-LesteTogoTongaTrinidad and TobagoTunisiaTurkeyTurkmenistanTuvaluUgandaUkraineUnited Arab EmiratesUnited KingdomUnited StatesUpper middle incomeUruguayUzbekistanVanuatuVenezuela, RBVietnamVirgin Islands (U.S.)West Bank and GazaWorldYemen, Rep.ZambiaZimbabwe Linea del tempo:
Questa scala temporale mostra un grafico dal 1971 anno al 2015 anno. Thailand. I dati fino ad 1970 anno non disponibili. Il numero di osservazioni attuali secondo i date: 45.
La fonte (nome):
Indicatori dello sviluppo mondiale
La fonte (organizzazione):
World Bank staff estimates based on sources and methods in World Bank's "The Changing Wealth of Nations: Measuring Sustainable Development in the New Millennium" (2011).
Categorie:
Economy & Growth, Energy & Mining, Environment
sono stati aggiornati
23 apr 2017 anni
Indicatori delle variazioni dei valori per anni
Minima:
0.001
1 gen 1996 anni
Massimo:
0.376
1 gen 1980 anni
Alla data di osservazione
Valore
Variazione assoluta
La variazione rispetto al valore precedente
1 gen 1971 anni
0.024
+0.024
0.0%
1 gen 1972 anni
0.002
-0.023
-93.3%
1 gen 1973 anni
0.003
+0.001
55.93%
1 gen 1974 anni
0.015
+0.012
481.2%
1 gen 1975 anni
0.303
+0.289
1.95 Mille.%
1 gen 1976 anni
0.037
-0.266
-87.65%
1 gen 1977 anni
0.065
+0.027
72.63%
1 gen 1978 anni
0.214
+0.15
231.27%
1 gen 1979 anni
0.276
+0.062
28.92%
1 gen 1980 anni
0.376
+0.1
36.06%
1 gen 1981 anni
0.332
-0.043
-11.57%
1 gen 1982 anni
0.184
-0.149
-44.7%
1 gen 1983 anni
0.141
-0.043
-23.16%
1 gen 1984 anni
0.113
-0.028
-19.93%
1 gen 1985 anni
0.12
+0.007
5.75%
1 gen 1986 anni
0.11
-0.009
-7.79%
1 gen 1987 anni
0.015
-0.095
-86.08%
1 gen 1988 anni
0.022
+0.007
46.27%
1 gen 1989 anni
0.235
+0.212
945.56%
1 gen 1990 anni
0.199
-0.036
-15.32%
1 gen 1991 anni
0.093
-0.106
-53.31%
1 gen 1992 anni
0.023
-0.07
-75.57%
1 gen 1993 anni
0.02
-0.003
-11.1%
1 gen 1994 anni
0.007
-0.013
-63.7%
1 gen 1995 anni
0.008
+0.0
3.68%
1 gen 1996 anni
0.001
-0.006
-80.86%
1 gen 1997 anni
0.003
+0.002
129.66%
1 gen 1998 anni
0.004
+0.0
6.03%
1 gen 1999 anni
0.004
+0.001
22.08%
1 gen 2000 anni
0.005
+0.0
8.19%
1 gen 2001 anni
0.006
+0.001
23.99%
1 gen 2002 anni
0.002
-0.004
-68.7%
1 gen 2003 anni
0.008
+0.006
356.47%
1 gen 2004 anni
0.008
0.0
-4.86%
1 gen 2005 anni
0.013
+0.005
59.54%
1 gen 2006 anni
0.018
+0.005
39.79%
1 gen 2007 anni
0.037
+0.02
111.7%
1 gen 2008 anni
0.055
+0.017
47.01%
1 gen 2009 anni
0.053
-0.001
-2.35%
1 gen 2010 anni
0.038
-0.016
-29.59%
1 gen 2011 anni
0.047
+0.009
24.74%
1 gen 2012 anni
0.029
-0.018
-38.05%
1 gen 2013 anni
0.042
+0.013
44.84%
1 gen 2014 anni
0.035
-0.007
-17.66%
1 gen 2015 anni
0.032
-0.003
-8.13%
Classificazione dei paesi secondo i statistiche attuali per anni


Commenti: