29
/it/
it
AIzaSyAYiBZKx7MnpbEhh9jyipgxe19OcubqV5w
April 1, 2024
26169
Central Europe and the Baltics
CEB
false
2
1
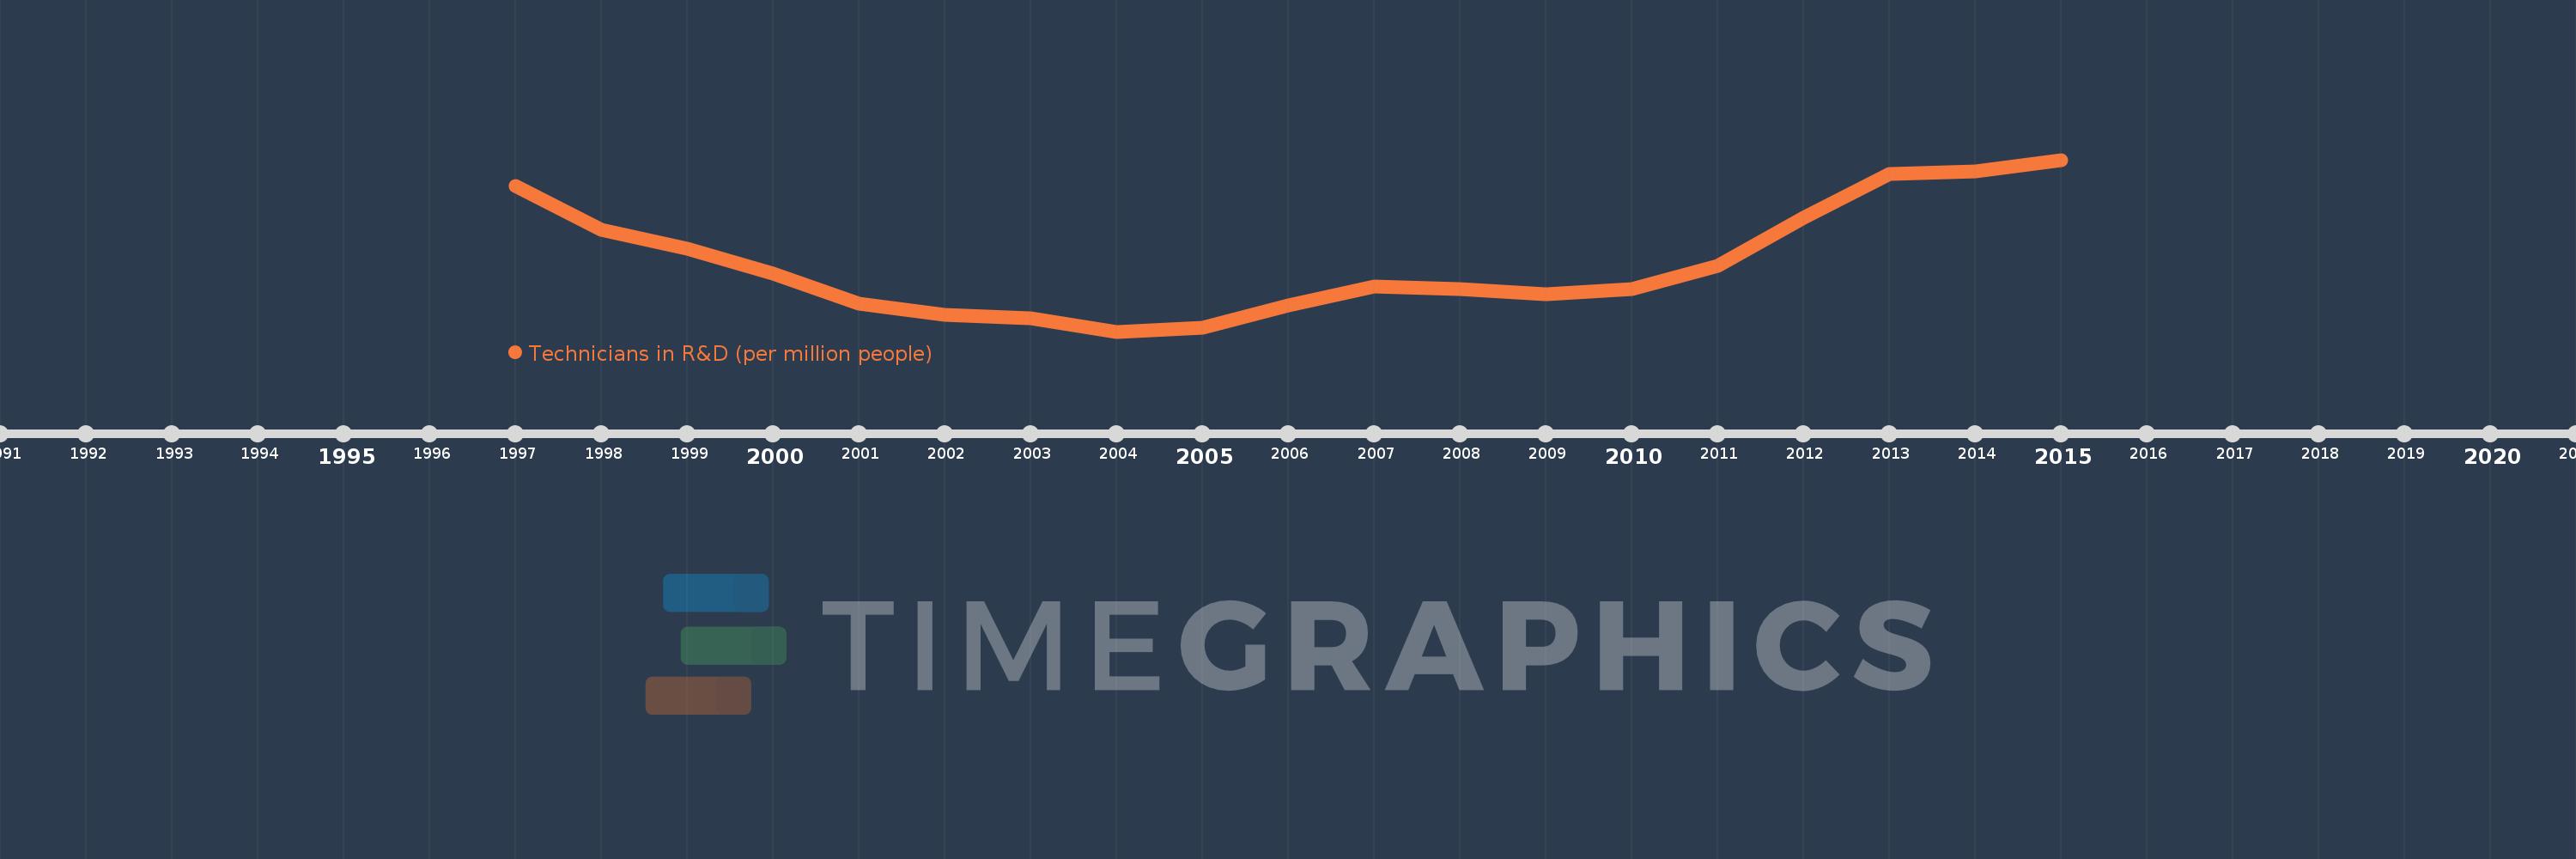
Technicians in R&D (per million people)
2015,2014,2013,2012,2011,2010,2009,2008,2007,2006,2005,2004,2003,2002,2001,2000,1999,1998,1997
Queste statistiche in altri paesi:
Linea del tempo:
Questa scala temporale mostra un grafico dal 1997 anno al 2015 anno. Central Europe and the Baltics. I dati fino ad 1996 anno non disponibili. Il numero di osservazioni attuali secondo i date: 19.
La fonte (nome):
Indicatori dello sviluppo mondiale
La fonte (organizzazione):
United Nations Educational, Scientific, and Cultural Organization (UNESCO) Institute for Statistics.
Categorie:
Science & Technology
sono stati aggiornati
23 apr 2017 anni
Indicatori delle variazioni dei valori per anni
Minima:
404.59
1 gen 2004 anni
Massimo:
638.52
1 gen 2015 anni
Alla data di osservazione
Valore
Variazione assoluta
La variazione rispetto al valore precedente
1 gen 1997 anni
602.533
+602.533
0.0%
1 gen 1998 anni
543.199
-59.334
-9.85%
1 gen 1999 anni
517.998
-25.201
-4.64%
1 gen 2000 anni
483.206
-34.792
-6.72%
1 gen 2001 anni
443.093
-40.113
-8.3%
1 gen 2002 anni
427.733
-15.359
-3.47%
1 gen 2003 anni
423.17
-4.563
-1.07%
1 gen 2004 anni
404.59
-18.58
-4.39%
1 gen 2005 anni
409.89
+5.3
1.31%
1 gen 2006 anni
440.378
+30.488
7.44%
1 gen 2007 anni
466.504
+26.126
5.93%
1 gen 2008 anni
462.273
-4.231
-0.91%
1 gen 2009 anni
455.613
-6.66
-1.44%
1 gen 2010 anni
463.022
+7.41
1.63%
1 gen 2011 anni
494.17
+31.148
6.73%
1 gen 2012 anni
559.088
+64.918
13.14%
1 gen 2013 anni
618.79
+59.702
10.68%
1 gen 2014 anni
622.461
+3.671
0.59%
1 gen 2015 anni
638.52
+16.059
2.58%
Classificazione dei paesi secondo i statistiche attuali per anni


Commenti: