30
/it/
AIzaSyAYiBZKx7MnpbEhh9jyipgxe19OcubqV5w
April 1, 2024
261052
Tanzania
TZA
true
2
1
Industry, value added (constant LCU)
2016,2015,2014,2013,2012,2011,2010,2009,2008,2007,2006,2005,2004,2003,2002,2001,2000,1999,1998,1997,1996,1995,1994,1993,1992,1991
Download
Biblioteca di statistiche globali →Tanzania →

Industry, value added (constant LCU)

Queste statistiche in altri paesi:

AfghanistanAlbaniaAlgeriaAntigua and BarbudaArgentinaArmeniaAustraliaAustriaAzerbaijanBahamas, TheBahrainBangladeshBelarusBelgiumBelizeBeninBermudaBhutanBoliviaBosnia and HerzegovinaBotswanaBrazilBrunei DarussalamBulgariaBurkina FasoBurundiCabo VerdeCambodiaCameroonCanadaCayman IslandsCentral African RepublicChadChileChinaColombiaComorosCongo, Dem. Rep.Congo, Rep.Costa RicaCote d'IvoireCroatiaCubaCyprusCzech RepublicDenmarkDjiboutiDominicaDominican RepublicEcuadorEgypt, Arab Rep.El SalvadorEquatorial GuineaEritreaEstoniaEthiopiaFijiFinlandFranceGabonGambia, TheGeorgiaGermanyGhanaGreeceGrenadaGuatemalaGuineaGuinea-BissauGuyanaHaitiHondurasHong Kong SAR, ChinaHungaryIcelandIndiaIndonesiaIran, Islamic Rep.IraqIrelandItalyJamaicaJapanJordanKazakhstanKenyaKiribatiKorea, Rep.KosovoKuwaitKyrgyz RepublicLao PDRLatviaLebanonLesothoLiberiaLithuaniaLuxembourgMacedonia, FYRMadagascarMalawiMalaysiaMaldivesMaliMarshall IslandsMauritaniaMauritiusMexicoMicronesia, Fed. Sts.MoldovaMongoliaMontenegroMoroccoMozambiqueMyanmarNamibiaNepalNetherlandsNew ZealandNicaraguaNigerNigeriaNorwayOmanPakistanPalauPanamaPapua New GuineaParaguayPeruPhilippinesPolandPortugalPuerto RicoQatarRomaniaRussian FederationRwandaSamoaSao Tome and PrincipeSaudi ArabiaSenegalSerbiaSeychellesSierra LeoneSingaporeSlovak RepublicSloveniaSolomon IslandsSomaliaSouth AfricaSpainSri LankaSt. Kitts and NevisSt. LuciaSt. Vincent and the GrenadinesSudanSurinameSwazilandSwedenSwitzerlandSyrian Arab RepublicTajikistanTanzaniaThailandTimor-LesteTogoTongaTrinidad and TobagoTunisiaTurkeyTurkmenistanTuvaluUgandaUkraineUnited Arab EmiratesUnited KingdomUnited StatesUruguayUzbekistanVanuatuVenezuela, RBVietnamWest Bank and GazaZambiaZimbabwe

Linea del tempo:

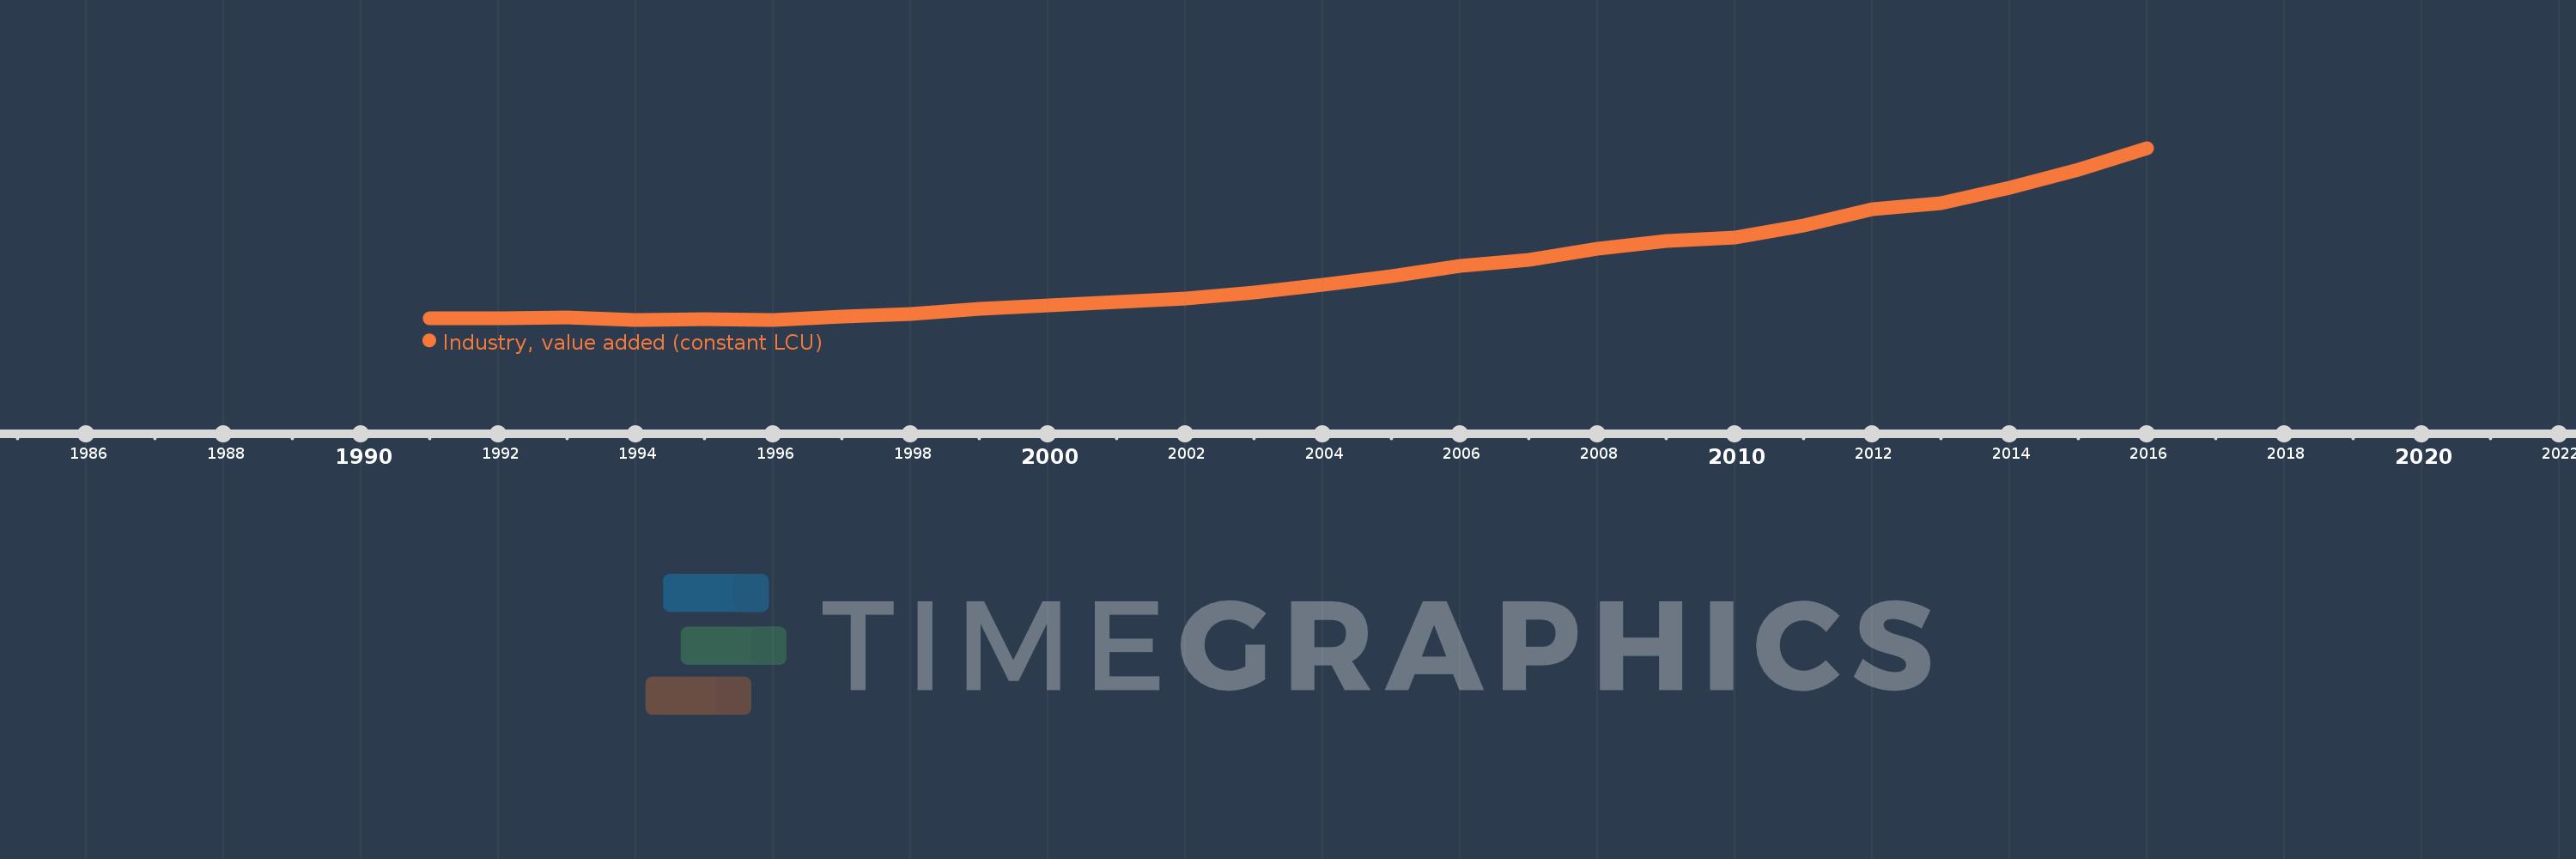
Questa scala temporale mostra un grafico dal 1991 anno al 2016 anno. Tanzania. I dati fino ad 1990 anno non disponibili. Il numero di osservazioni attuali secondo i date: 26.

La fonte (nome):

Indicatori dello sviluppo mondiale

La fonte (organizzazione):

World Bank national accounts data, and OECD National Accounts data files.

Categorie:

Economy & Growth

sono stati aggiornati

23 apr 2017 anni

Indicatori delle variazioni dei valori per anni

In media:
4.428 Trln
Minima:
2.053 Trln
1 gen 1996 anni
Massimo:
10.174 Trln
1 gen 2016 anni
Alla data di osservazione
Valore
Variazione assoluta
La variazione rispetto al valore precedente
1 gen 1991 anni
2.138 Trln
+2.138 Trln
0.0%
1 gen 1992 anni
2.142 Trln
+3.618 Mlrd
0.17%
1 gen 1993 anni
2.143 Trln
+933.005 Mln
0.04%
1 gen 1994 anni
2.06 Trln
-82.664 Mlrd
-3.86%
1 gen 1995 anni
2.094 Trln
+33.308 Mlrd
1.62%
1 gen 1996 anni
2.053 Trln
-40.202 Mlrd
-1.92%
1 gen 1997 anni
2.191 Trln
+137.245 Mlrd
6.68%
1 gen 1998 anni
2.337 Trln
+146.409 Mlrd
6.68%
1 gen 1999 anni
2.578 Trln
+240.529 Mlrd
10.29%
1 gen 2000 anni
2.751 Trln
+173.547 Mlrd
6.73%
1 gen 2001 anni
2.875 Trln
+124.325 Mlrd
4.52%
1 gen 2002 anni
3.065 Trln
+189.909 Mlrd
6.6%
1 gen 2003 anni
3.353 Trln
+287.305 Mlrd
9.37%
1 gen 2004 anni
3.72 Trln
+366.803 Mlrd
10.94%
1 gen 2005 anni
4.125 Trln
+405.121 Mlrd
10.89%
1 gen 2006 anni
4.586 Trln
+460.925 Mlrd
11.17%
1 gen 2007 anni
4.869 Trln
+283.667 Mlrd
6.19%
1 gen 2008 anni
5.406 Trln
+536.825 Mlrd
11.02%
1 gen 2009 anni
5.759 Trln
+353.133 Mlrd
6.53%
1 gen 2010 anni
5.949 Trln
+190.192 Mlrd
3.3%
1 gen 2011 anni
6.49 Trln
+540.548 Mlrd
9.09%
1 gen 2012 anni
7.272 Trln
+781.894 Mlrd
12.05%
1 gen 2013 anni
7.566 Trln
+294.253 Mlrd
4.05%
1 gen 2014 anni
8.287 Trln
+721.252 Mlrd
9.53%
1 gen 2015 anni
9.144 Trln
+857.155 Mlrd
10.34%
1 gen 2016 anni
10.174 Trln
+1.03 Trln
11.26%

Classificazione dei paesi secondo i statistiche attuali per anni