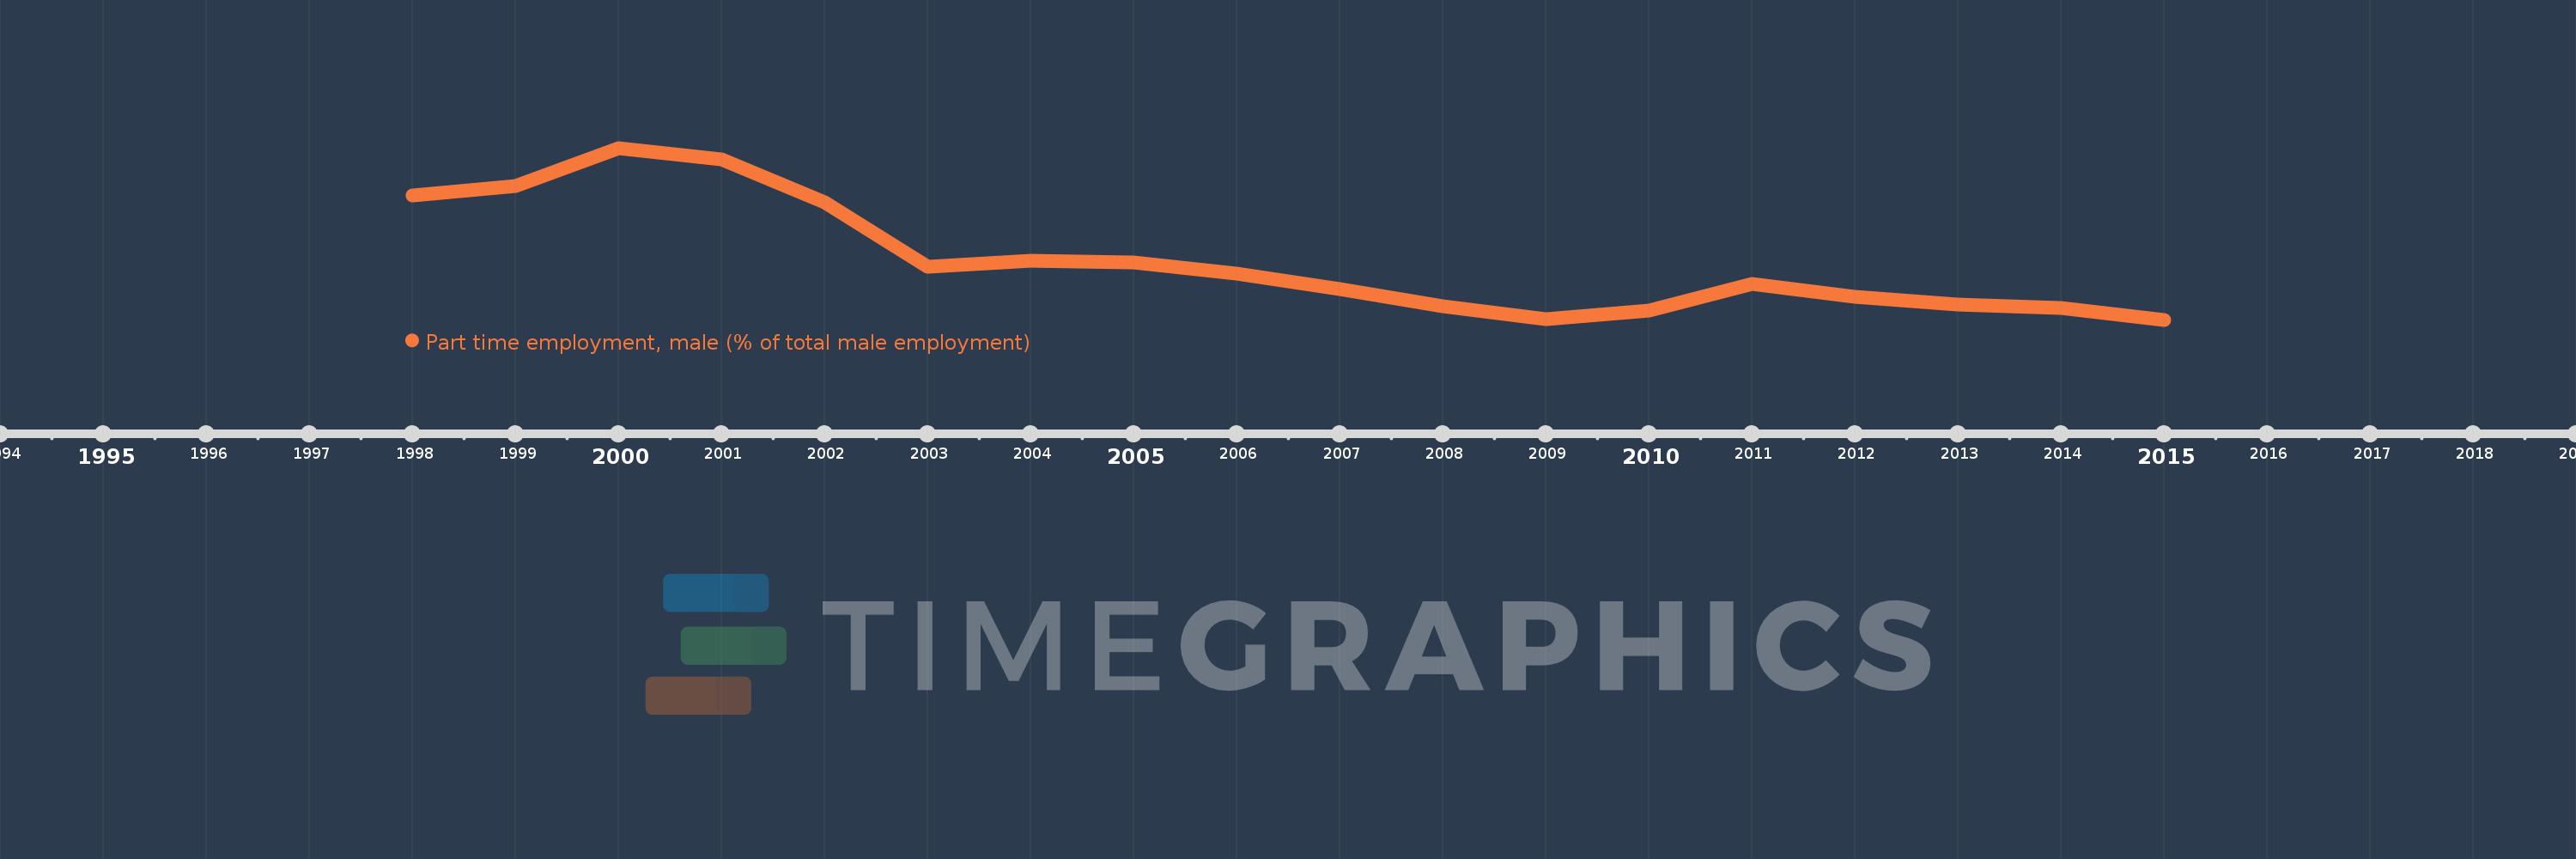
Questa scala temporale mostra un grafico dal 1998 anno al 2015 anno. Central Europe and the Baltics. I dati fino ad 1997 anno non disponibili. Il numero di osservazioni attuali secondo i date: 18.
La fonte (nome):
Indicatori dello sviluppo mondiale
La fonte (organizzazione):
International Labour Organization, Key Indicators of the Labour Market database.
Categorie:
Social Protection & Labor, Gender
sono stati aggiornati
23 apr 2017 anni
Indicatori delle variazioni dei valori per anni
In media:
6.036
Minima:
4.9
1 gen 2015 anni
Massimo:
8.206
1 gen 2000 anni
Alla data di osservazione
Valore
Variazione assoluta
La variazione rispetto al valore precedente
1 gen 1998 anni
7.291
+7.291
0.0%
1 gen 1999 anni
7.472
+0.18
2.47%
1 gen 2000 anni
8.206
+0.735
9.83%
1 gen 2001 anni
7.993
-0.213
-2.6%
1 gen 2002 anni
7.167
-0.826
-10.33%
1 gen 2003 anni
5.914
-1.253
-17.48%
1 gen 2004 anni
6.043
+0.129
2.18%
1 gen 2005 anni
6.009
-0.034
-0.56%
1 gen 2006 anni
5.787
-0.222
-3.69%
1 gen 2007 anni
5.485
-0.302
-5.22%
1 gen 2008 anni
5.156
-0.329
-6.01%
1 gen 2009 anni
4.911
-0.245
-4.74%
1 gen 2010 anni
5.072
+0.161
3.27%
1 gen 2011 anni
5.595
+0.524
10.32%
1 gen 2012 anni
5.334
-0.262
-4.68%
1 gen 2013 anni
5.191
-0.143
-2.68%
1 gen 2014 anni
5.127
-0.063
-1.22%
1 gen 2015 anni
4.9
-0.227
-4.43%
Classificazione dei paesi secondo i statistiche attuali per anni
