29
/it/
it
AIzaSyAYiBZKx7MnpbEhh9jyipgxe19OcubqV5w
April 1, 2024
259734
Tajikistan
TJK
true
2
1
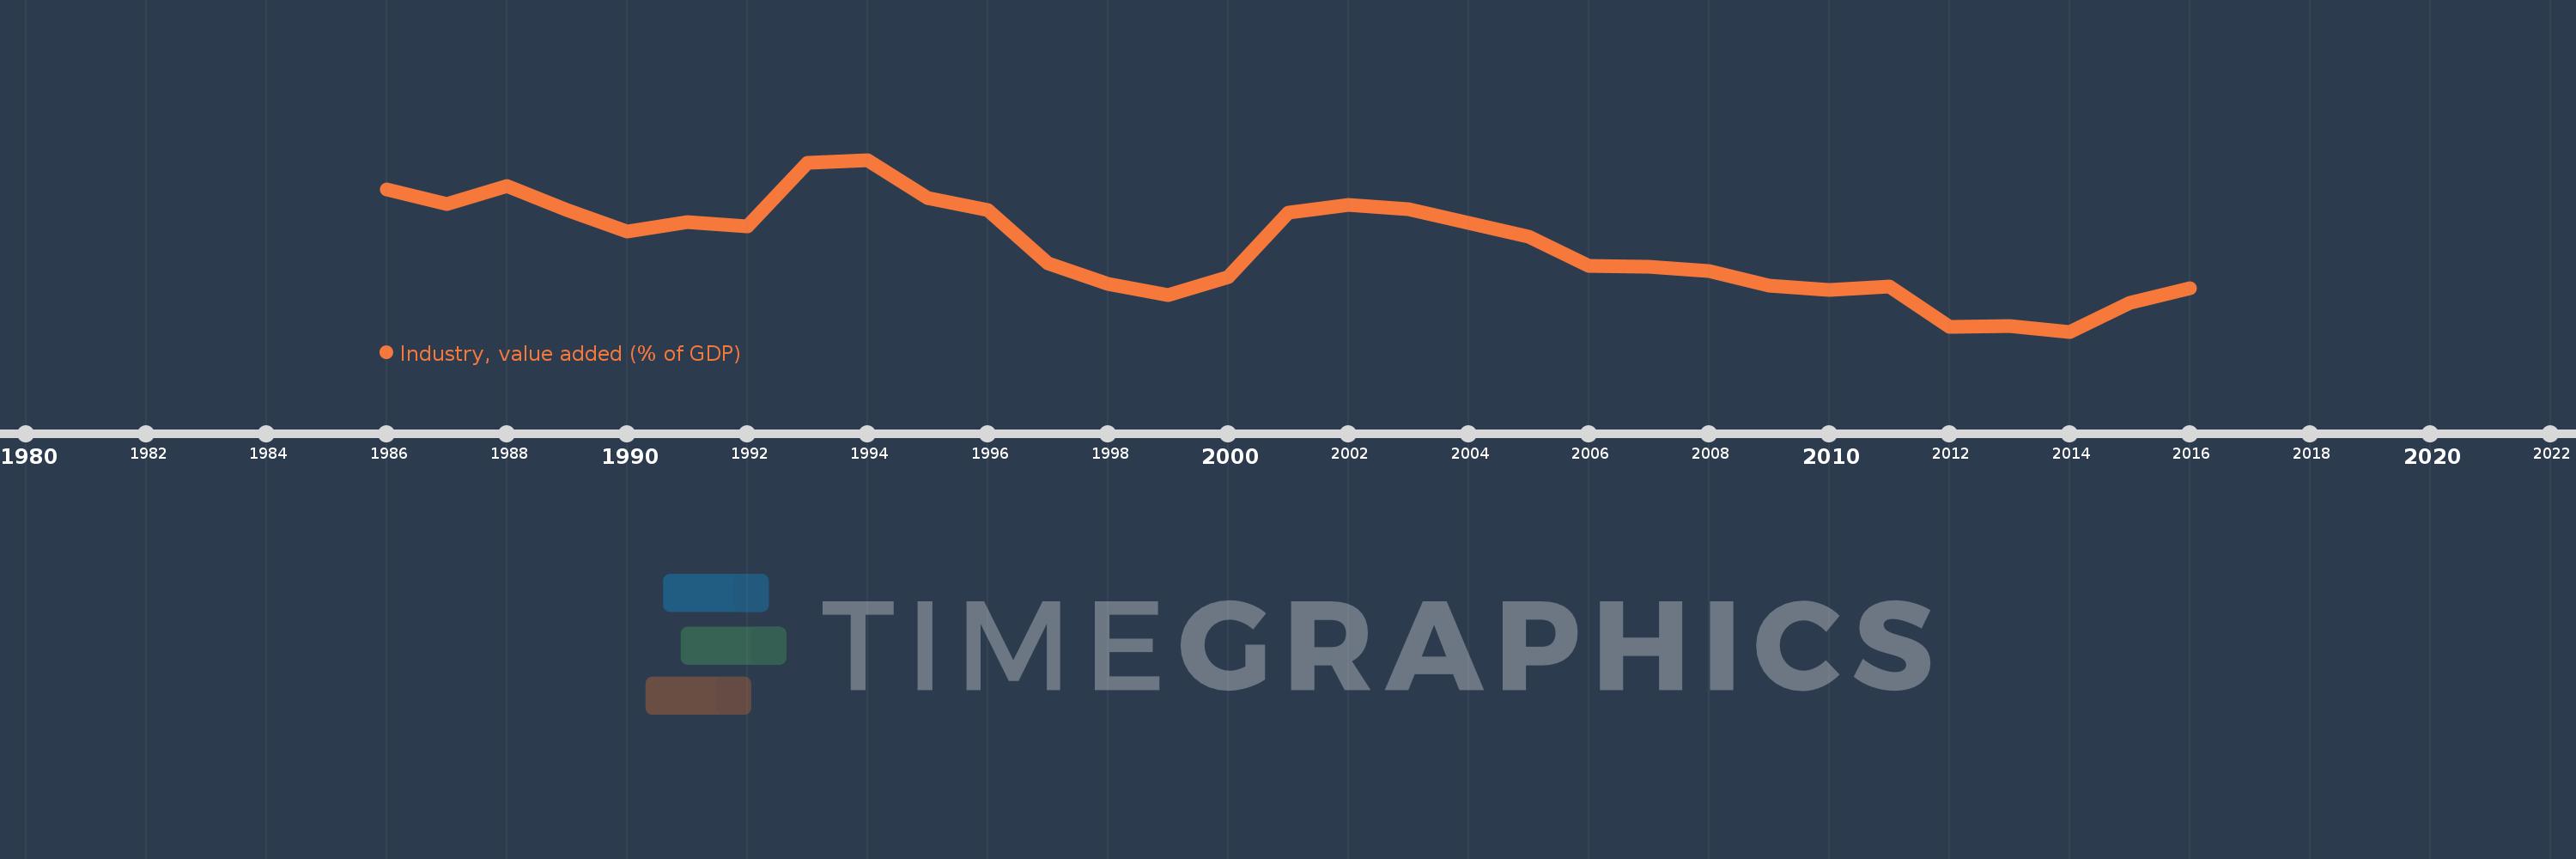
Industry, value added (% of GDP)
2016,2015,2014,2013,2012,2011,2010,2009,2008,2007,2006,2005,2004,2003,2002,2001,2000,1999,1998,1997,1996,1995,1994,1993,1992,1991,1990,1989,1988,1987,1986
Queste statistiche in altri paesi:
AfghanistanAlbaniaAlgeriaAndorraAngolaAntigua and BarbudaArab WorldArgentinaArmeniaArubaAustraliaAustriaAzerbaijanBahamas, TheBahrainBangladeshBarbadosBelarusBelgiumBelizeBeninBermudaBhutanBoliviaBosnia and HerzegovinaBotswanaBrazilBrunei DarussalamBulgariaBurkina FasoBurundiCabo VerdeCambodiaCameroonCanadaCaribbean small statesCayman IslandsCentral African RepublicCentral Europe and the BalticsChadChileChinaColombiaComorosCongo, Dem. Rep.Congo, Rep.Costa RicaCote d'IvoireCroatiaCubaCyprusCzech RepublicDenmarkDjiboutiDominicaDominican RepublicEarly-demographic dividendEast Asia & PacificEast Asia & Pacific (excluding high income)East Asia & Pacific (IDA & IBRD countries)EcuadorEgypt, Arab Rep.El SalvadorEquatorial GuineaEritreaEstoniaEthiopiaEuro areaEurope & Central AsiaEurope & Central Asia (excluding high income)Europe & Central Asia (IDA & IBRD countries)European UnionFijiFinlandFragile and conflict affected situationsFranceGabonGambia, TheGeorgiaGermanyGhanaGreeceGrenadaGuatemalaGuineaGuinea-BissauGuyanaHeavily indebted poor countries (HIPC)High incomeHondurasHong Kong SAR, ChinaHungaryIBRD onlyIcelandIDA & IBRD totalIDA blendIDA onlyIDA totalIndiaIndonesiaIran, Islamic Rep.IrelandItalyJamaicaJapanJordanKazakhstanKenyaKiribatiKorea, Rep.KosovoKuwaitKyrgyz RepublicLao PDRLate-demographic dividendLatin America & Caribbean Latin America & Caribbean (excluding high income)Latin America & the Caribbean (IDA & IBRD countries)LatviaLeast developed countries: UN classificationLebanonLesothoLibyaLiechtensteinLithuaniaLow & middle incomeLow incomeLower middle incomeLuxembourgMacao SAR, ChinaMacedonia, FYRMadagascarMalawiMalaysiaMaldivesMaliMaltaMarshall IslandsMauritaniaMauritiusMexicoMicronesia, Fed. Sts.Middle East & North AfricaMiddle East & North Africa (excluding high income)Middle East & North Africa (IDA & IBRD countries)Middle incomeMoldovaMongoliaMontenegroMoroccoMozambiqueMyanmarNamibiaNepalNetherlandsNew CaledoniaNew ZealandNicaraguaNigerNigeriaNorth AmericaNorwayOECD membersOmanOther small statesPacific island small statesPakistanPalauPanamaPapua New GuineaParaguayPeruPhilippinesPolandPortugalPost-demographic dividendPre-demographic dividendPuerto RicoQatarRomaniaRussian FederationRwandaSao Tome and PrincipeSaudi ArabiaSenegalSerbiaSeychellesSierra LeoneSingaporeSlovak RepublicSloveniaSmall statesSolomon IslandsSomaliaSouth AfricaSouth AsiaSouth Asia (IDA & IBRD)SpainSri LankaSt. Kitts and NevisSt. LuciaSt. Vincent and the GrenadinesSub-Saharan Africa Sub-Saharan Africa (excluding high income)Sub-Saharan Africa (IDA & IBRD countries)SudanSurinameSwazilandSwedenSwitzerlandSyrian Arab RepublicTajikistanTanzaniaThailandTimor-LesteTogoTongaTrinidad and TobagoTunisiaTurkeyTurkmenistanTuvaluUgandaUkraineUnited KingdomUnited StatesUpper middle incomeUruguayUzbekistanVanuatuVenezuela, RBVietnamWest Bank and GazaWorldYemen, Rep.ZambiaZimbabwe Linea del tempo:
Questa scala temporale mostra un grafico dal 1986 anno al 2016 anno. Tajikistan. I dati fino ad 1985 anno non disponibili. Il numero di osservazioni attuali secondo i date: 31.
La fonte (nome):
Indicatori dello sviluppo mondiale
La fonte (organizzazione):
World Bank national accounts data, and OECD National Accounts data files.
Categorie:
Economy & Growth
sono stati aggiornati
23 apr 2017 anni
Indicatori delle variazioni dei valori per anni
Minima:
21.747
1 gen 2014 anni
Massimo:
46.533
1 gen 1994 anni
Alla data di osservazione
Valore
Variazione assoluta
La variazione rispetto al valore precedente
1 gen 1986 anni
42.211
+42.211
0.0%
1 gen 1987 anni
40.135
-2.076
-4.92%
1 gen 1988 anni
42.742
+2.607
6.5%
1 gen 1989 anni
39.244
-3.498
-8.18%
1 gen 1990 anni
36.232
-3.012
-7.68%
1 gen 1991 anni
37.586
+1.354
3.74%
1 gen 1992 anni
36.937
-0.649
-1.73%
1 gen 1993 anni
46.055
+9.118
24.68%
1 gen 1994 anni
46.533
+0.478
1.04%
1 gen 1995 anni
41.014
-5.519
-11.86%
1 gen 1996 anni
39.341
-1.673
-4.08%
1 gen 1997 anni
31.562
-7.779
-19.77%
1 gen 1998 anni
28.669
-2.893
-9.17%
1 gen 1999 anni
27.006
-1.663
-5.8%
1 gen 2000 anni
29.619
+2.613
9.68%
1 gen 2001 anni
38.855
+9.236
31.18%
1 gen 2002 anni
40.076
+1.221
3.14%
1 gen 2003 anni
39.429
-0.647
-1.61%
1 gen 2004 anni
37.447
-1.983
-5.03%
1 gen 2005 anni
35.404
-2.043
-5.46%
1 gen 2006 anni
31.262
-4.141
-11.7%
1 gen 2007 anni
31.12
-0.142
-0.46%
1 gen 2008 anni
30.471
-0.649
-2.09%
1 gen 2009 anni
28.332
-2.139
-7.02%
1 gen 2010 anni
27.725
-0.607
-2.14%
1 gen 2011 anni
28.208
+0.483
1.74%
1 gen 2012 anni
22.48
-5.729
-20.31%
1 gen 2013 anni
22.513
+0.033
0.15%
1 gen 2014 anni
21.747
-0.766
-3.4%
1 gen 2015 anni
25.916
+4.169
19.17%
1 gen 2016 anni
27.997
+2.081
8.03%
Classificazione dei paesi secondo i statistiche attuali per anni


Commenti: