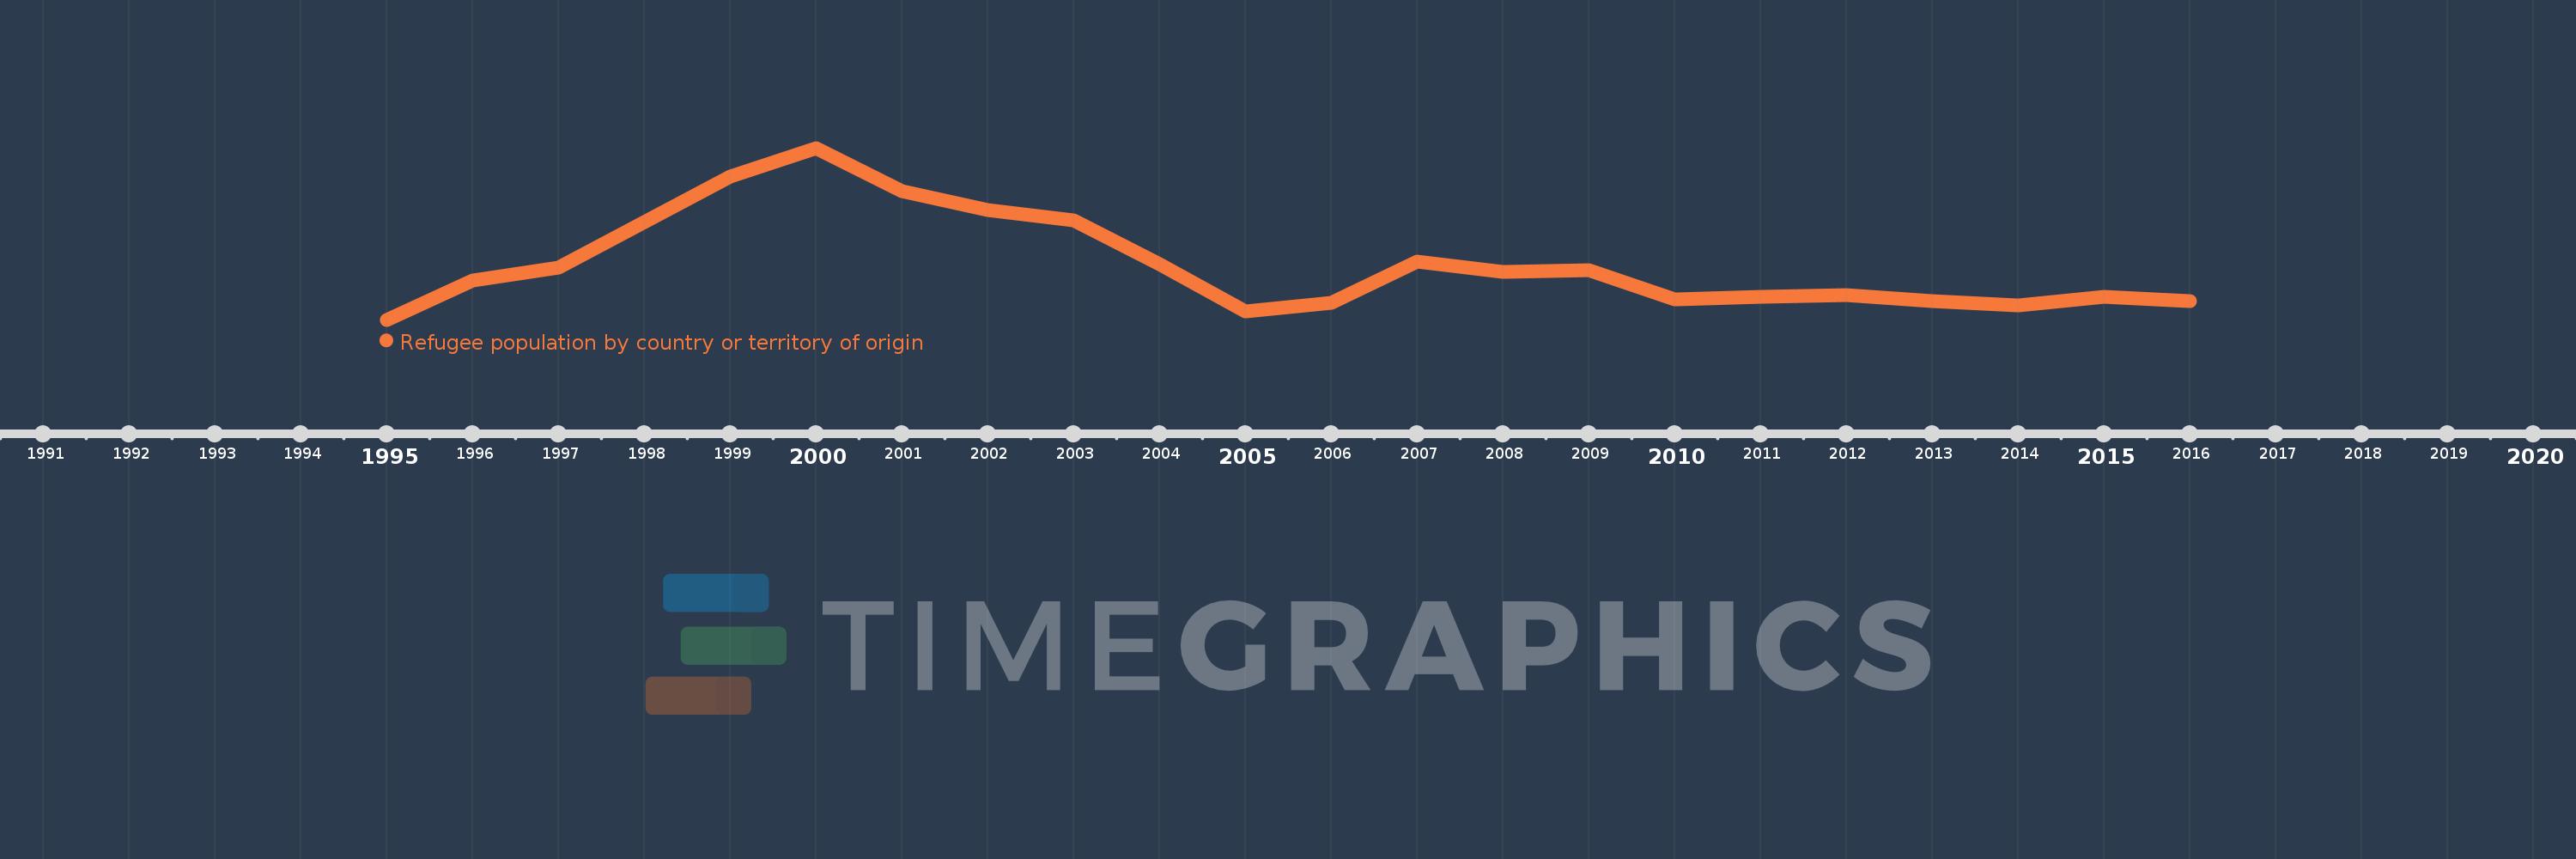
Questa scala temporale mostra un grafico dal 1995 anno al 2016 anno. Switzerland. I dati fino ad 1994 anno non disponibili. Il numero di osservazioni attuali secondo i date: 22.
La fonte (nome):
Indicatori dello sviluppo mondiale
La fonte (organizzazione):
United Nations High Commissioner for Refugees (UNHCR), Statistical Yearbook and data files, complemented by statistics on Palestinian refugees under the mandate of the UNRWA as published on its website. Data from UNHCR are available online at: www.unhcr.org/statistics/populationdatabase.
Categorie:
Health, Social Development
sono stati aggiornati
23 apr 2017 anni
Indicatori delle variazioni dei valori per anni
In media:
34.773
Minima:
8.0
1 gen 1995 anni
Massimo:
91.0
1 gen 2000 anni
Alla data di osservazione
Valore
Variazione assoluta
La variazione rispetto al valore precedente
1 gen 1995 anni
8.0
+8.0
0.0%
1 gen 1996 anni
27.0
+19.0
237.5%
1 gen 1997 anni
33.0
+6.0
22.22%
1 gen 1998 anni
55.0
+22.0
66.67%
1 gen 1999 anni
77.0
+22.0
40.0%
1 gen 2000 anni
91.0
+14.0
18.18%
1 gen 2001 anni
70.0
-21.0
-23.08%
1 gen 2002 anni
61.0
-9.0
-12.86%
1 gen 2003 anni
56.0
-5.0
-8.2%
1 gen 2004 anni
35.0
-21.0
-37.5%
1 gen 2005 anni
12.0
-23.0
-65.71%
1 gen 2006 anni
16.0
+4.0
33.33%
1 gen 2007 anni
36.0
+20.0
125.0%
1 gen 2008 anni
31.0
-5.0
-13.89%
1 gen 2009 anni
32.0
+1.0
3.23%
1 gen 2010 anni
18.0
-14.0
-43.75%
1 gen 2011 anni
19.0
+1.0
5.56%
1 gen 2012 anni
20.0
+1.0
5.26%
1 gen 2013 anni
17.0
-3.0
-15.0%
1 gen 2014 anni
15.0
-2.0
-11.76%
1 gen 2015 anni
19.0
+4.0
26.67%
1 gen 2016 anni
17.0
-2.0
-10.53%
Classificazione dei paesi secondo i statistiche attuali per anni
