29
/it/
it
AIzaSyAYiBZKx7MnpbEhh9jyipgxe19OcubqV5w
April 1, 2024
257156
Switzerland
CHE
true
2
1
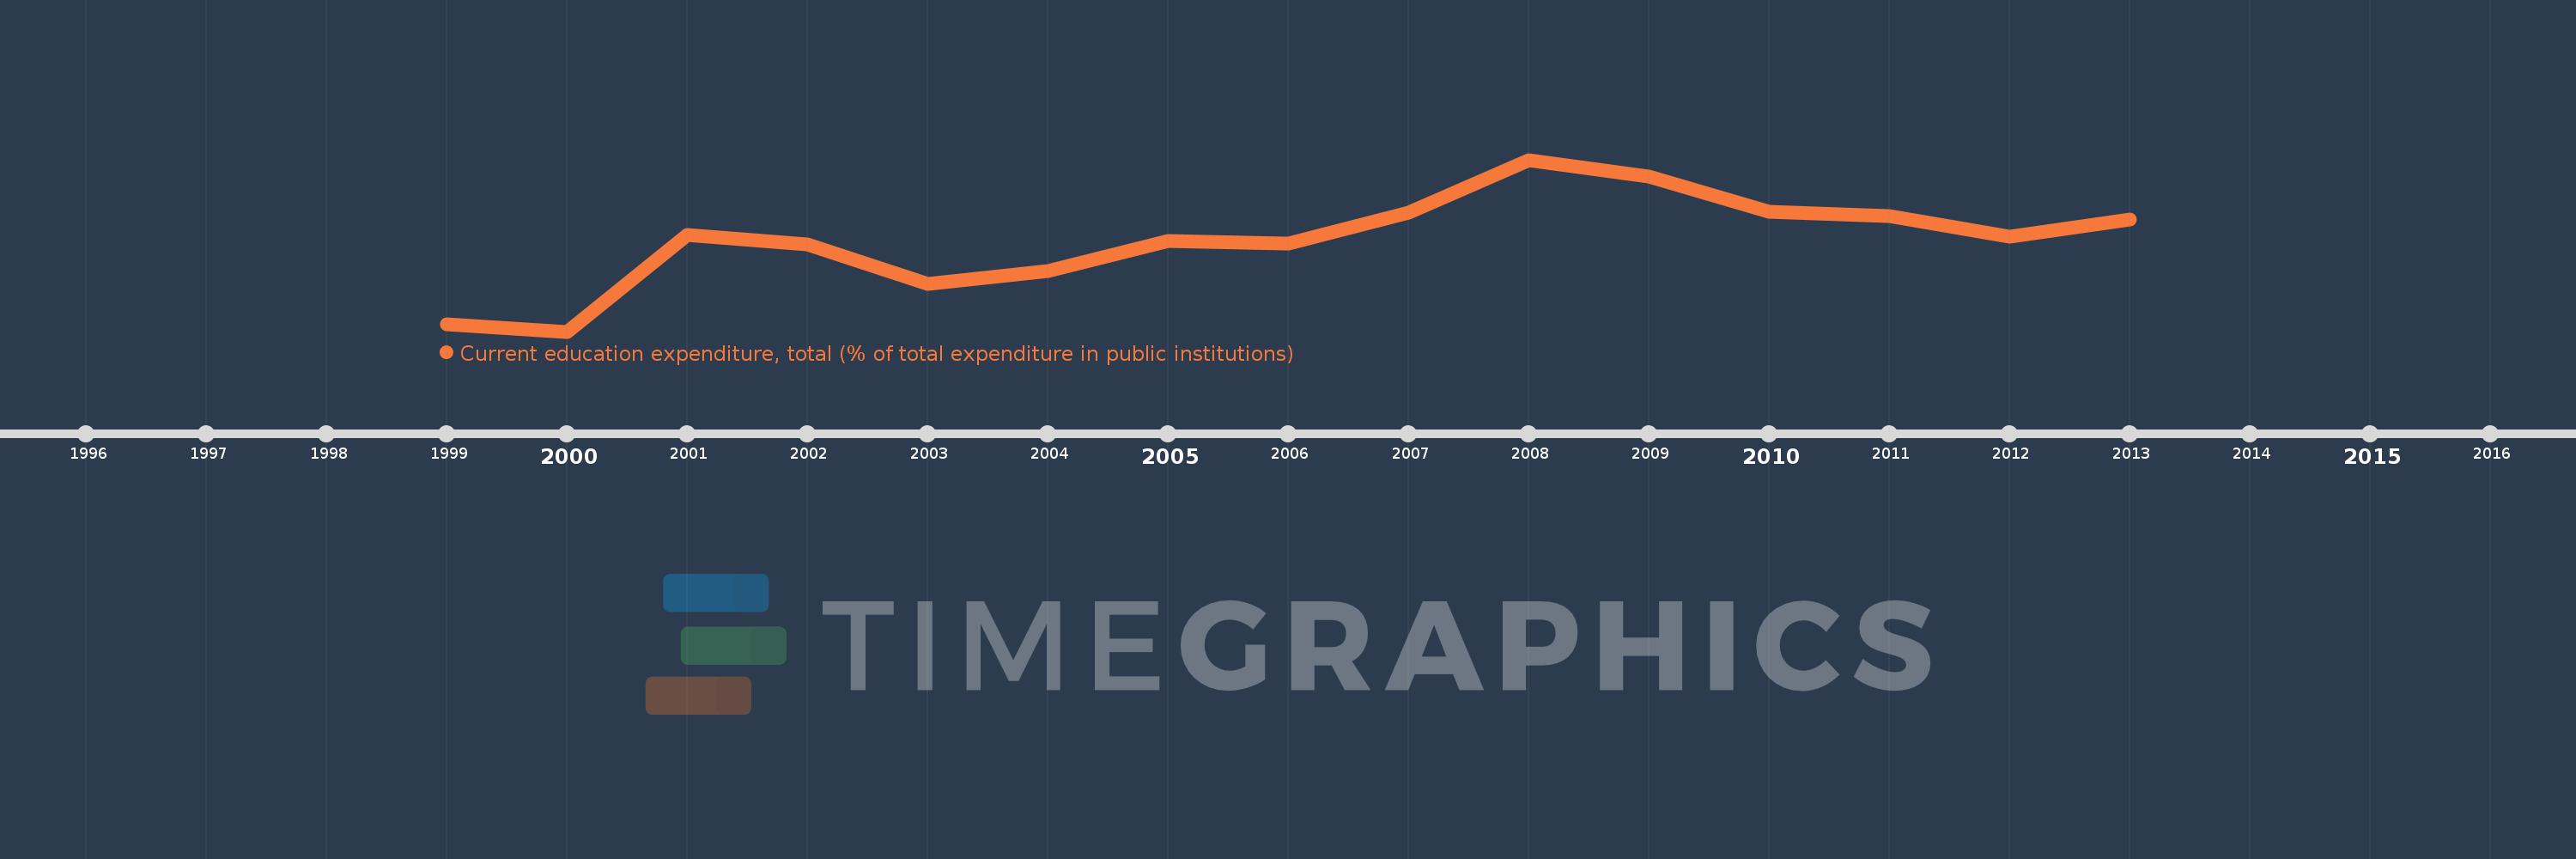
Current education expenditure, total (% of total expenditure in public institutions)
2013,2012,2011,2010,2009,2008,2007,2006,2005,2004,2003,2002,2001,2000,1999
Queste statistiche in altri paesi:
Linea del tempo:
Questa scala temporale mostra un grafico dal 1999 anno al 2013 anno. Switzerland. I dati fino ad 1998 anno non disponibili. Il numero di osservazioni attuali secondo i date: 15.
La fonte (nome):
Indicatori dello sviluppo mondiale
La fonte (organizzazione):
United Nations Educational, Scientific, and Cultural Organization (UNESCO) Institute for Statistics.
Categorie:
Education
sono stati aggiornati
23 apr 2017 anni
Indicatori delle variazioni dei valori per anni
Minima:
89.122
1 gen 2000 anni
Massimo:
92.514
1 gen 2008 anni
Alla data di osservazione
Valore
Variazione assoluta
La variazione rispetto al valore precedente
1 gen 1999 anni
89.26
+89.26
0.0%
1 gen 2000 anni
89.122
-0.138
-0.15%
1 gen 2001 anni
91.036
+1.914
2.15%
1 gen 2002 anni
90.835
-0.201
-0.22%
1 gen 2003 anni
90.062
-0.773
-0.85%
1 gen 2004 anni
90.315
+0.253
0.28%
1 gen 2005 anni
90.914
+0.599
0.66%
1 gen 2006 anni
90.853
-0.061
-0.07%
1 gen 2007 anni
91.474
+0.621
0.68%
1 gen 2008 anni
92.514
+1.04
1.14%
1 gen 2009 anni
92.186
-0.328
-0.35%
1 gen 2010 anni
91.486
-0.7
-0.76%
1 gen 2011 anni
91.395
-0.091
-0.1%
1 gen 2012 anni
90.993
-0.403
-0.44%
1 gen 2013 anni
91.339
+0.346
0.38%
Classificazione dei paesi secondo i statistiche attuali per anni


Commenti: