29
/it/
it
AIzaSyAYiBZKx7MnpbEhh9jyipgxe19OcubqV5w
April 1, 2024
25647
Central Europe and the Baltics
CEB
false
2
1
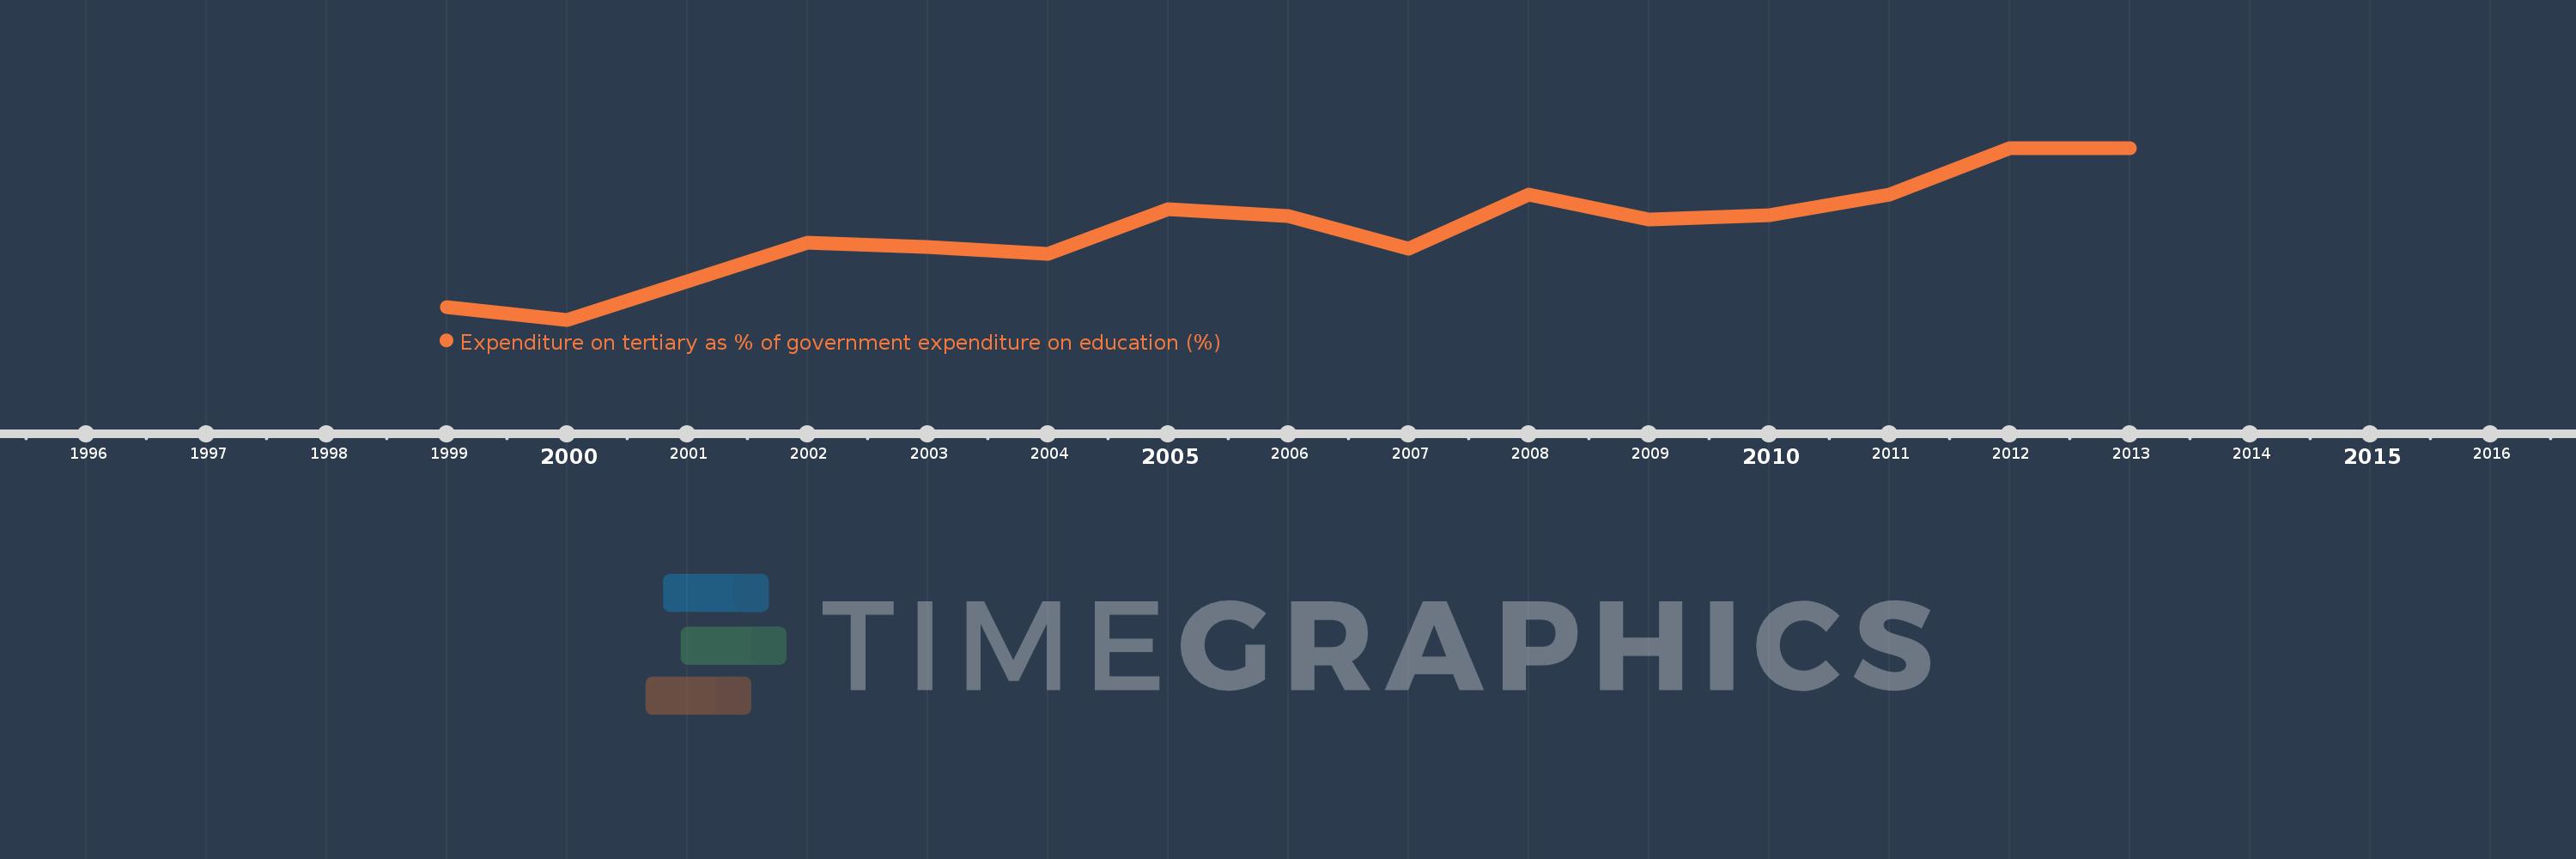
Expenditure on tertiary as % of government expenditure on education (%)
2013,2012,2011,2010,2009,2008,2007,2006,2005,2004,2003,2002,2000,1999
Queste statistiche in altri paesi:
Linea del tempo:
Questa scala temporale mostra un grafico dal 1999 anno al 2013 anno. Central Europe and the Baltics. I dati fino ad 1998 anno non disponibili. Il numero di osservazioni attuali secondo i date: 14.
La fonte (nome):
Indicatori dello sviluppo mondiale
La fonte (organizzazione):
UNESCO Institute for Statistics
Categorie:
Education
sono stati aggiornati
23 apr 2017 anni
Indicatori delle variazioni dei valori per anni
Minima:
17.342
1 gen 2000 anni
Massimo:
23.393
1 gen 2012 anni
Alla data di osservazione
Valore
Variazione assoluta
La variazione rispetto al valore precedente
1 gen 1999 anni
17.795
+17.795
0.0%
1 gen 2000 anni
17.342
-0.453
-2.55%
1 gen 2002 anni
20.042
+2.7
15.57%
1 gen 2003 anni
19.893
-0.15
-0.75%
1 gen 2004 anni
19.657
-0.235
-1.18%
1 gen 2005 anni
21.231
+1.573
8.0%
1 gen 2006 anni
21.001
-0.229
-1.08%
1 gen 2007 anni
19.857
-1.144
-5.45%
1 gen 2008 anni
21.743
+1.886
9.5%
1 gen 2009 anni
20.874
-0.869
-3.99%
1 gen 2010 anni
21.021
+0.147
0.7%
1 gen 2011 anni
21.738
+0.717
3.41%
1 gen 2012 anni
23.393
+1.655
7.61%
1 gen 2013 anni
23.387
-0.005
-0.02%
Classificazione dei paesi secondo i statistiche attuali per anni


Commenti: