29
/it/
it
AIzaSyAYiBZKx7MnpbEhh9jyipgxe19OcubqV5w
April 1, 2024
252375
St. Vincent and the Grenadines
VCT
true
2
1
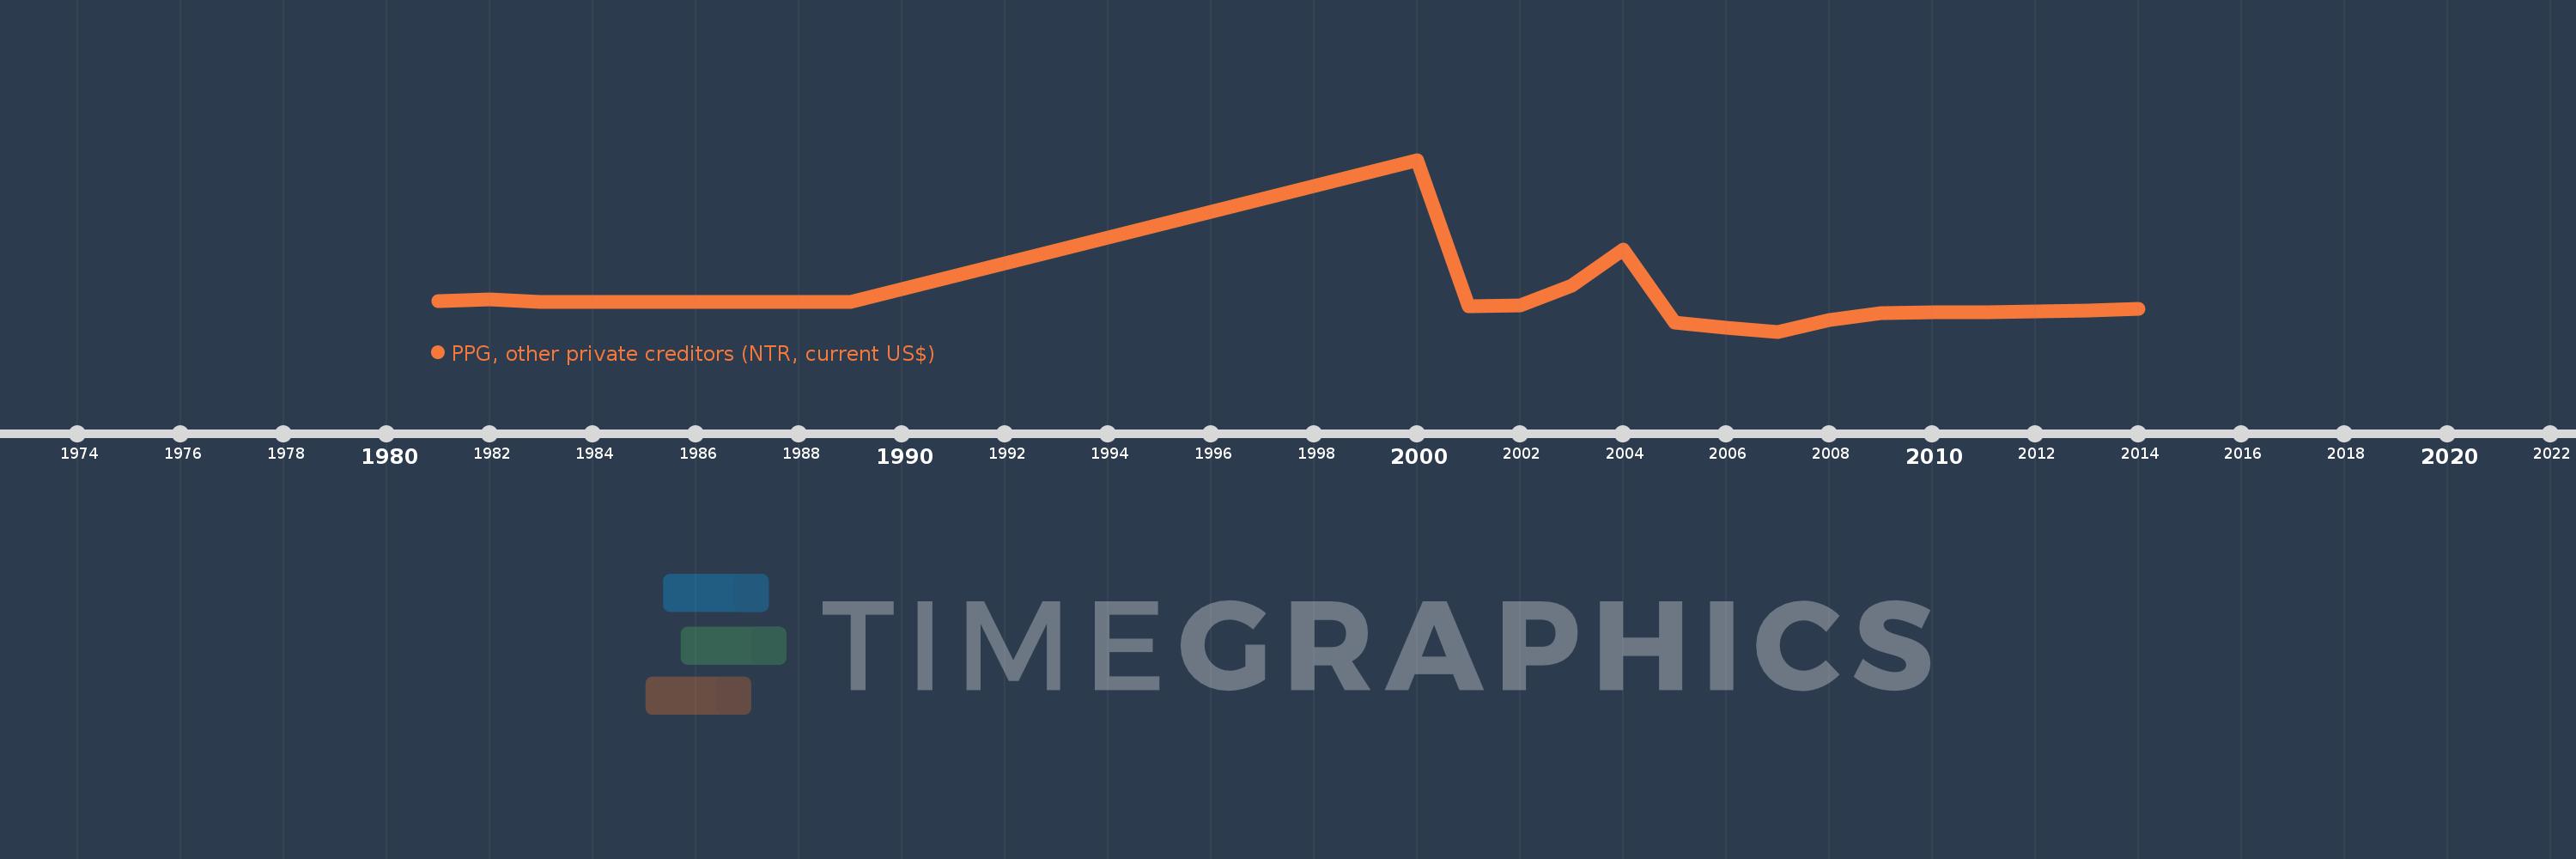
PPG, other private creditors (NTR, current US$)
2014,2013,2012,2011,2010,2009,2008,2007,2006,2005,2004,2003,2002,2001,2000,1989,1988,1987,1986,1985,1984,1983,1982,1981
Queste statistiche in altri paesi:
Linea del tempo:
Questa scala temporale mostra un grafico dal 1981 anno al 2014 anno. St. Vincent and the Grenadines. I dati fino ad 1980 anno non disponibili. Il numero di osservazioni attuali secondo i date: 24.
La fonte (nome):
Indicatori dello sviluppo mondiale
La fonte (organizzazione):
World Bank, International Debt Statistics.
Categorie:
External Debt
sono stati aggiornati
23 apr 2017 anni
Indicatori delle variazioni dei valori per anni
Minima:
-11.549 Mln
1 gen 2007 anni
Massimo:
54.792 Mln
1 gen 2000 anni
Alla data di osservazione
Valore
Variazione assoluta
La variazione rispetto al valore precedente
1 gen 1981 anni
135.0 Mille.
+135.0 Mille.
0.0%
1 gen 1982 anni
931.0 Mille.
+796.0 Mille.
589.63%
1 gen 1983 anni
-167.0 Mille.
-1.098 Mln
-117.94%
1 gen 1984 anni
-170.0 Mille.
-3.0 Mille.
1.8%
1 gen 1985 anni
-143.0 Mille.
+27.0 Mille.
-15.88%
1 gen 1986 anni
-134.0 Mille.
+9.0 Mille.
-6.29%
1 gen 1987 anni
-138.0 Mille.
-4.0 Mille.
2.99%
1 gen 1988 anni
-149.0 Mille.
-11.0 Mille.
7.97%
1 gen 1989 anni
-55.0 Mille.
+94.0 Mille.
-63.09%
1 gen 2000 anni
54.792 Mln
+54.847 Mln
-99.72 Mille.%
1 gen 2001 anni
-1.724 Mln
-56.516 Mln
-103.15%
1 gen 2002 anni
-1.487 Mln
+237.0 Mille.
-13.75%
1 gen 2003 anni
6.216 Mln
+7.703 Mln
-518.02%
1 gen 2004 anni
20.035 Mln
+13.819 Mln
222.31%
1 gen 2005 anni
-8.045 Mln
-28.08 Mln
-140.15%
1 gen 2006 anni
-10.054 Mln
-2.009 Mln
24.97%
1 gen 2007 anni
-11.549 Mln
-1.495 Mln
14.87%
1 gen 2008 anni
-7.159 Mln
+4.39 Mln
-38.01%
1 gen 2009 anni
-4.327 Mln
+2.832 Mln
-39.56%
1 gen 2010 anni
-4.175 Mln
+152.0 Mille.
-3.51%
1 gen 2011 anni
-4.023 Mln
+152.0 Mille.
-3.64%
1 gen 2012 anni
-3.599 Mln
+424.0 Mille.
-10.54%
1 gen 2013 anni
-3.392 Mln
+207.0 Mille.
-5.75%
1 gen 2014 anni
-2.594 Mln
+798.0 Mille.
-23.53%
Classificazione dei paesi secondo i statistiche attuali per anni


Commenti: