29
/it/
it
AIzaSyAYiBZKx7MnpbEhh9jyipgxe19OcubqV5w
April 1, 2024
252237
St. Vincent and the Grenadines
VCT
true
2
1
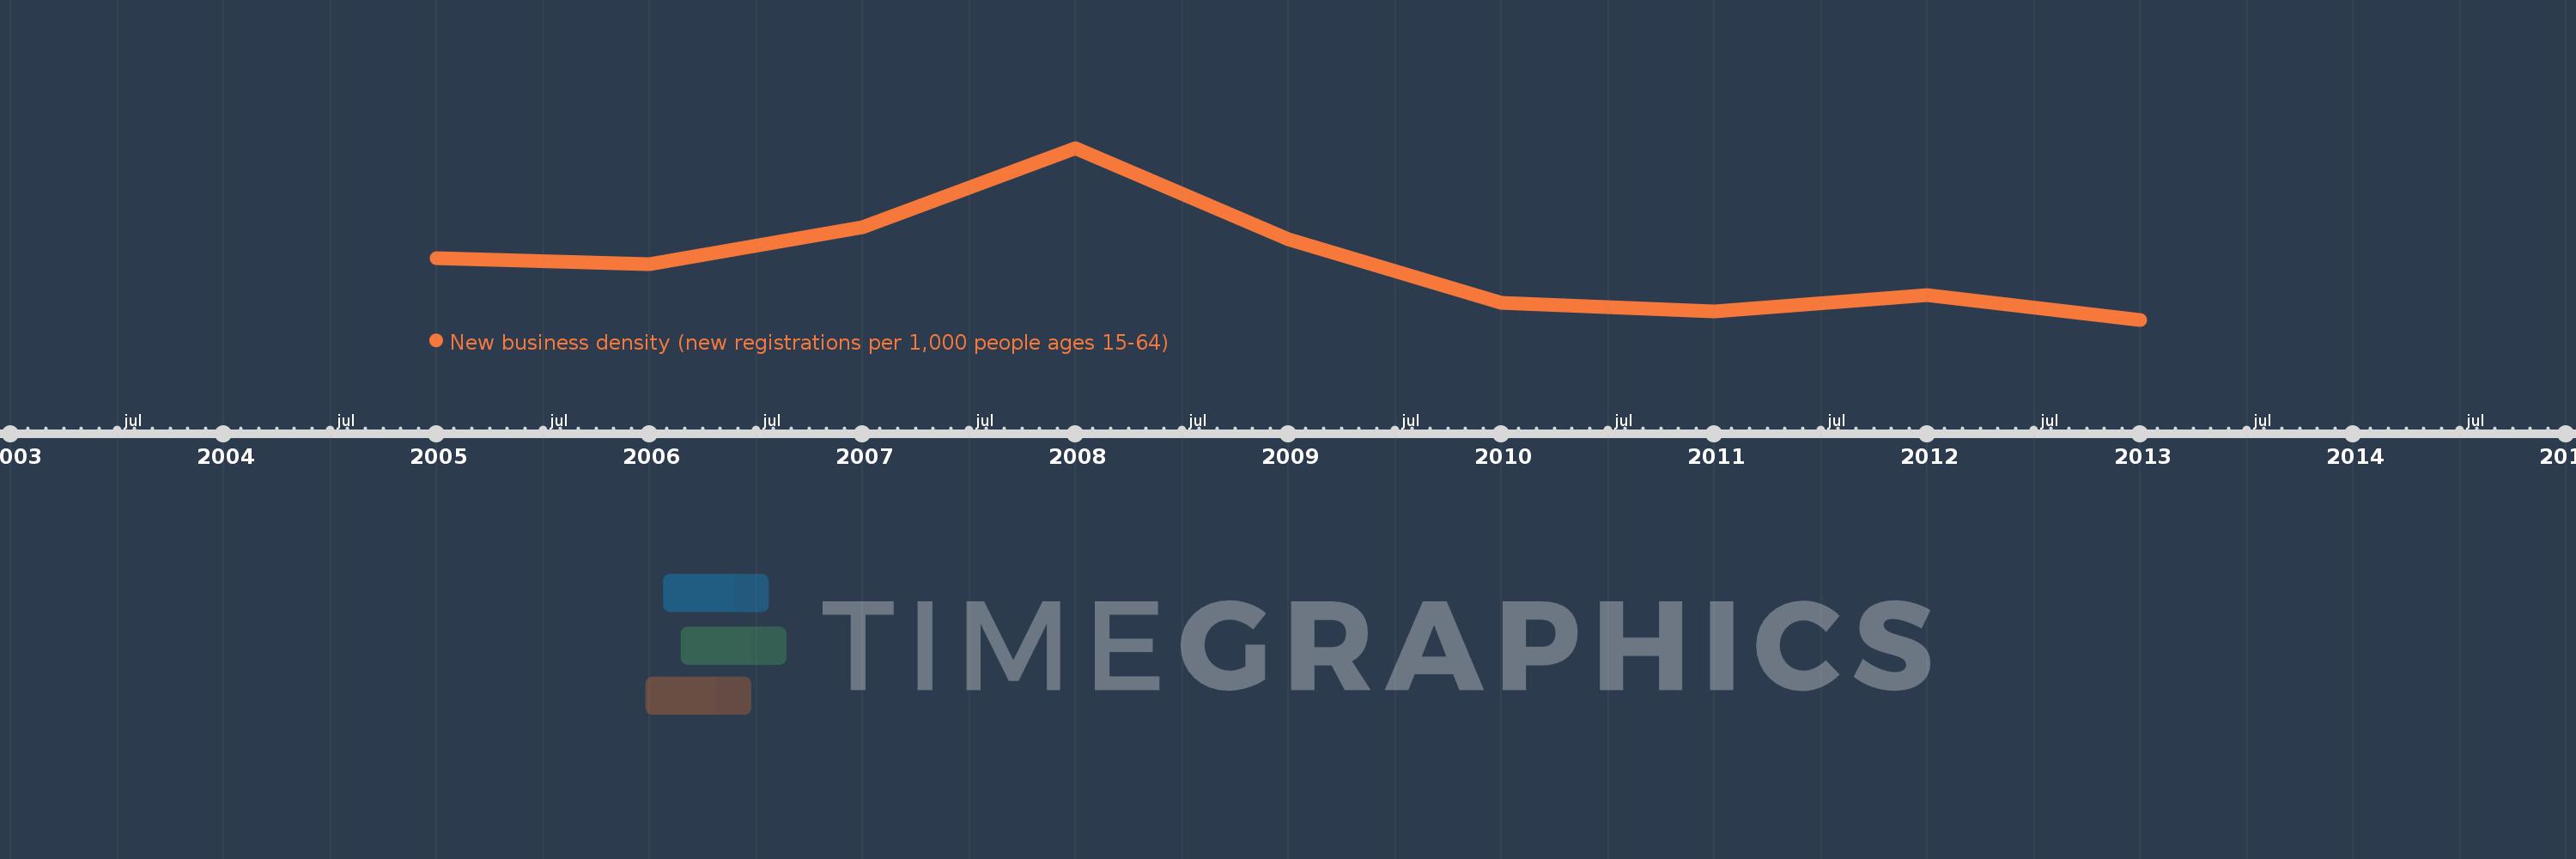
New business density (new registrations per 1,000 people ages 15-64)
2013,2012,2011,2010,2009,2008,2007,2006,2005
Queste statistiche in altri paesi:
Linea del tempo:
Questa scala temporale mostra un grafico dal 2005 anno al 2013 anno. St. Vincent and the Grenadines. I dati fino ad 2004 anno non disponibili. Il numero di osservazioni attuali secondo i date: 9.
La fonte (nome):
Indicatori dello sviluppo mondiale
La fonte (organizzazione):
World Bank's Entrepreneurship Survey and database (http://econ.worldbank.org/research/entrepreneurship).
Categorie:
Private Sector
sono stati aggiornati
23 apr 2017 anni
Indicatori delle variazioni dei valori per anni
Minima:
1.37
1 gen 2013 anni
Massimo:
2.751
1 gen 2008 anni
Alla data di osservazione
Valore
Variazione assoluta
La variazione rispetto al valore precedente
1 gen 2005 anni
1.866
+1.866
0.0%
1 gen 2006 anni
1.816
-0.05
-2.67%
1 gen 2007 anni
2.111
+0.294
16.2%
1 gen 2008 anni
2.751
+0.64
30.33%
1 gen 2009 anni
2.017
-0.734
-26.67%
1 gen 2010 anni
1.504
-0.513
-25.42%
1 gen 2011 anni
1.439
-0.065
-4.34%
1 gen 2012 anni
1.566
+0.128
8.87%
1 gen 2013 anni
1.37
-0.196
-12.54%
Classificazione dei paesi secondo i statistiche attuali per anni


Commenti: