29
/it/
it
AIzaSyAYiBZKx7MnpbEhh9jyipgxe19OcubqV5w
April 1, 2024
251815
St. Vincent and the Grenadines
VCT
true
2
1
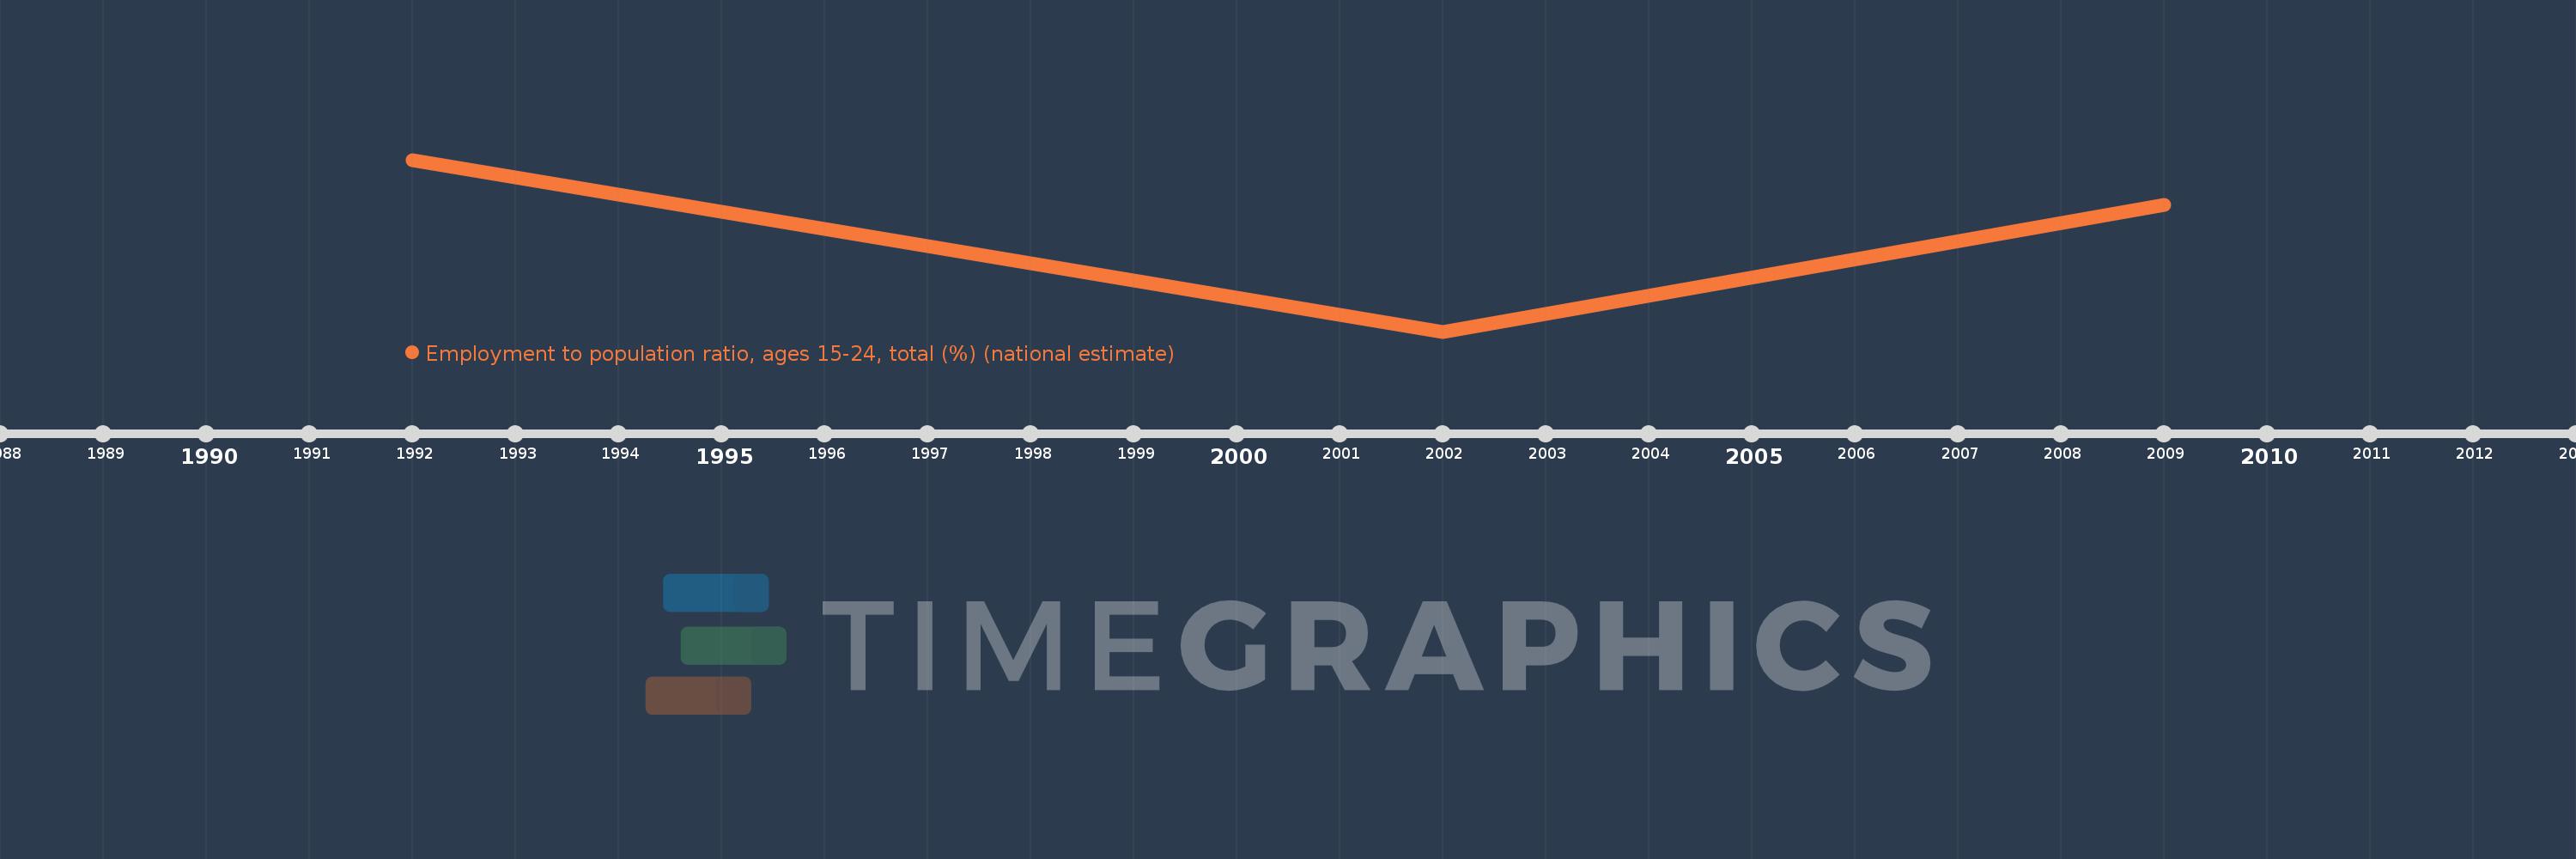
Employment to population ratio, ages 15-24, total (%) (national estimate)
2009,2002,1992
Queste statistiche in altri paesi:
Linea del tempo:
Questa scala temporale mostra un grafico dal 1992 anno al 2009 anno. St. Vincent and the Grenadines. I dati fino ad 1991 anno non disponibili. Il numero di osservazioni attuali secondo i date: 3.
La fonte (nome):
Indicatori dello sviluppo mondiale
La fonte (organizzazione):
International Labour Organization, Key Indicators of the Labour Market database.
Categorie:
Social Protection & Labor
sono stati aggiornati
23 apr 2017 anni
Indicatori delle variazioni dei valori per anni
Minima:
29.9
1 gen 2002 anni
Massimo:
36.4
1 gen 1992 anni
Alla data di osservazione
Valore
Variazione assoluta
La variazione rispetto al valore precedente
1 gen 1992 anni
36.4
+36.4
0.0%
1 gen 2002 anni
29.9
-6.5
-17.86%
1 gen 2009 anni
34.7
+4.8
16.05%
Classificazione dei paesi secondo i statistiche attuali per anni


Commenti: