30
/it/
AIzaSyAYiBZKx7MnpbEhh9jyipgxe19OcubqV5w
April 1, 2024
25030
Caribbean small states
CSS
false
2
1
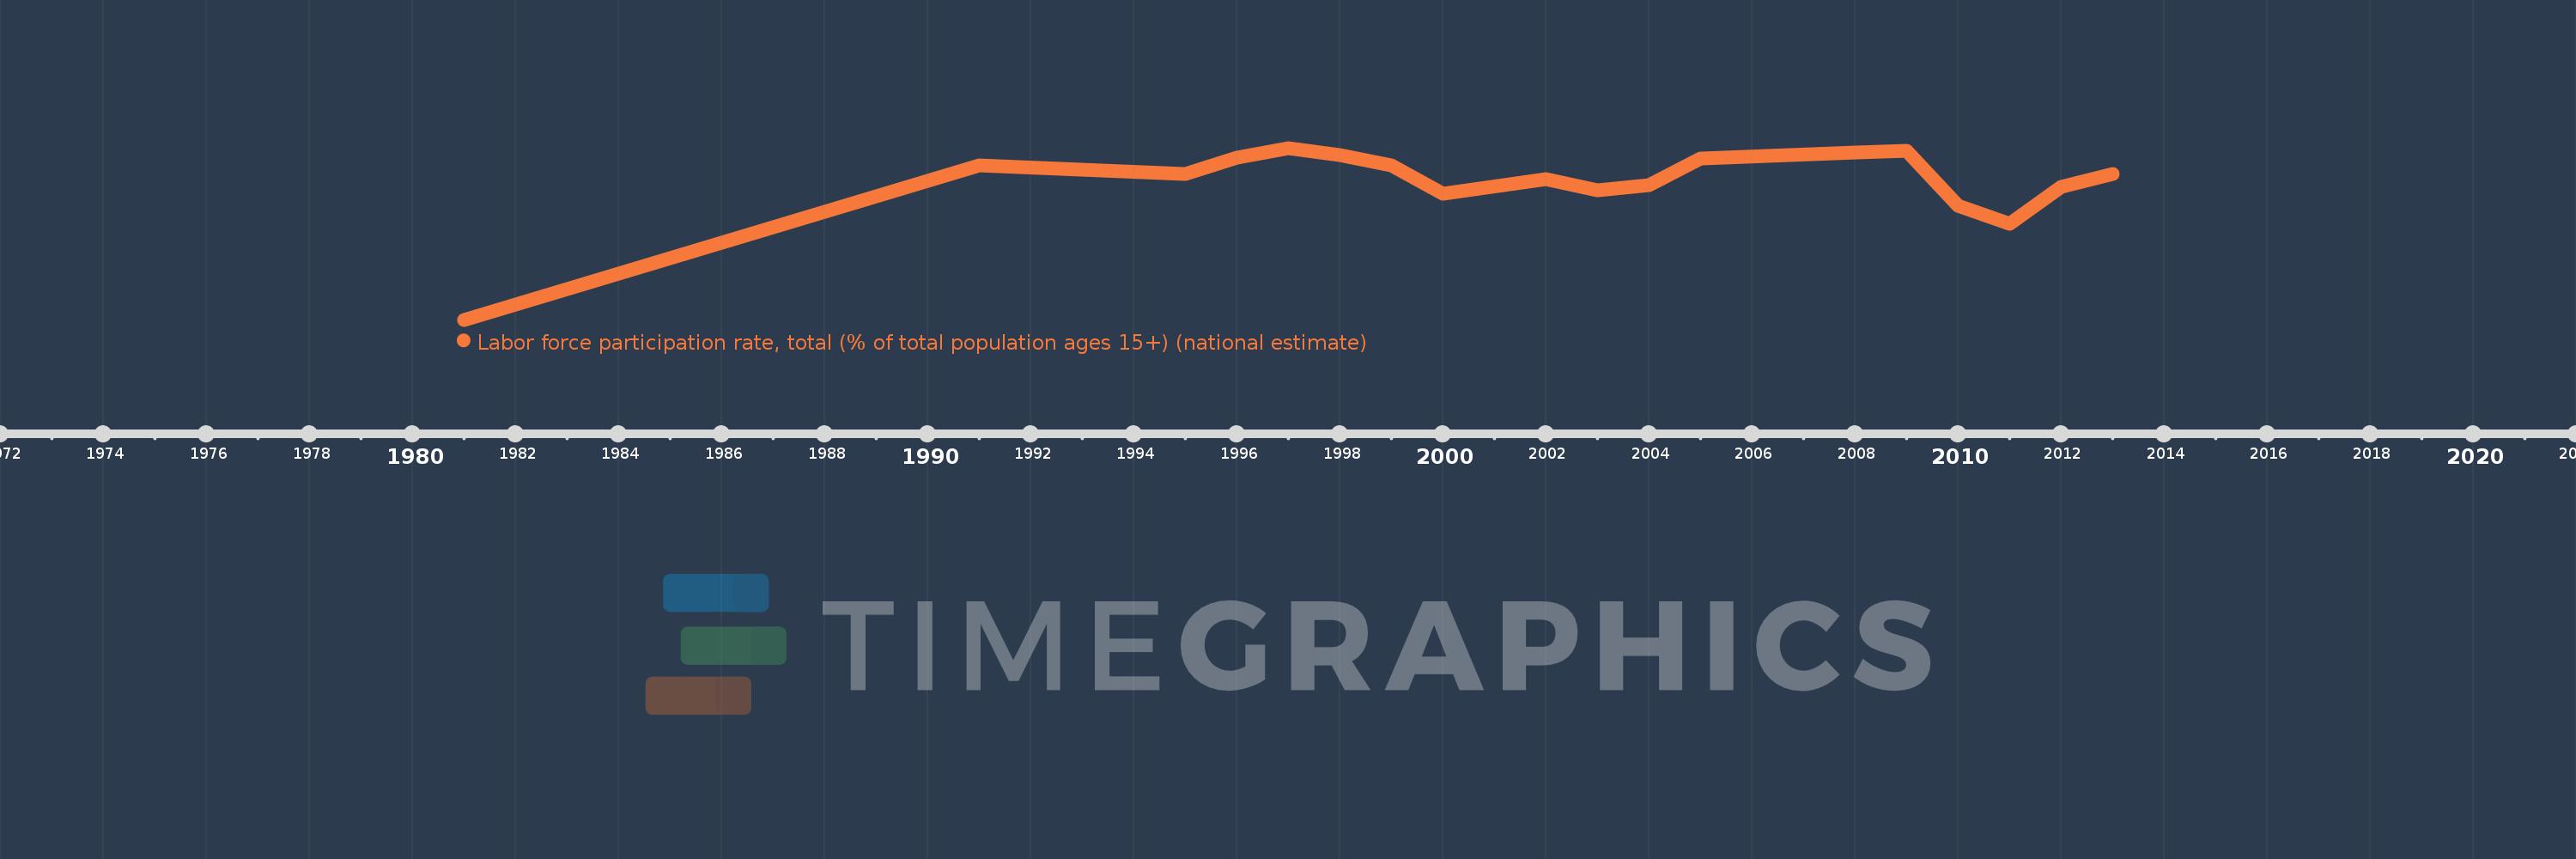
Labor force participation rate, total (% of total population ages 15+) (national estimate)
2013,2012,2011,2010,2009,2008,2005,2004,2003,2002,2000,1999,1998,1997,1996,1995,1991,1981
