29
/it/
it
AIzaSyAYiBZKx7MnpbEhh9jyipgxe19OcubqV5w
April 1, 2024
248713
Sri Lanka
LKA
true
2
1
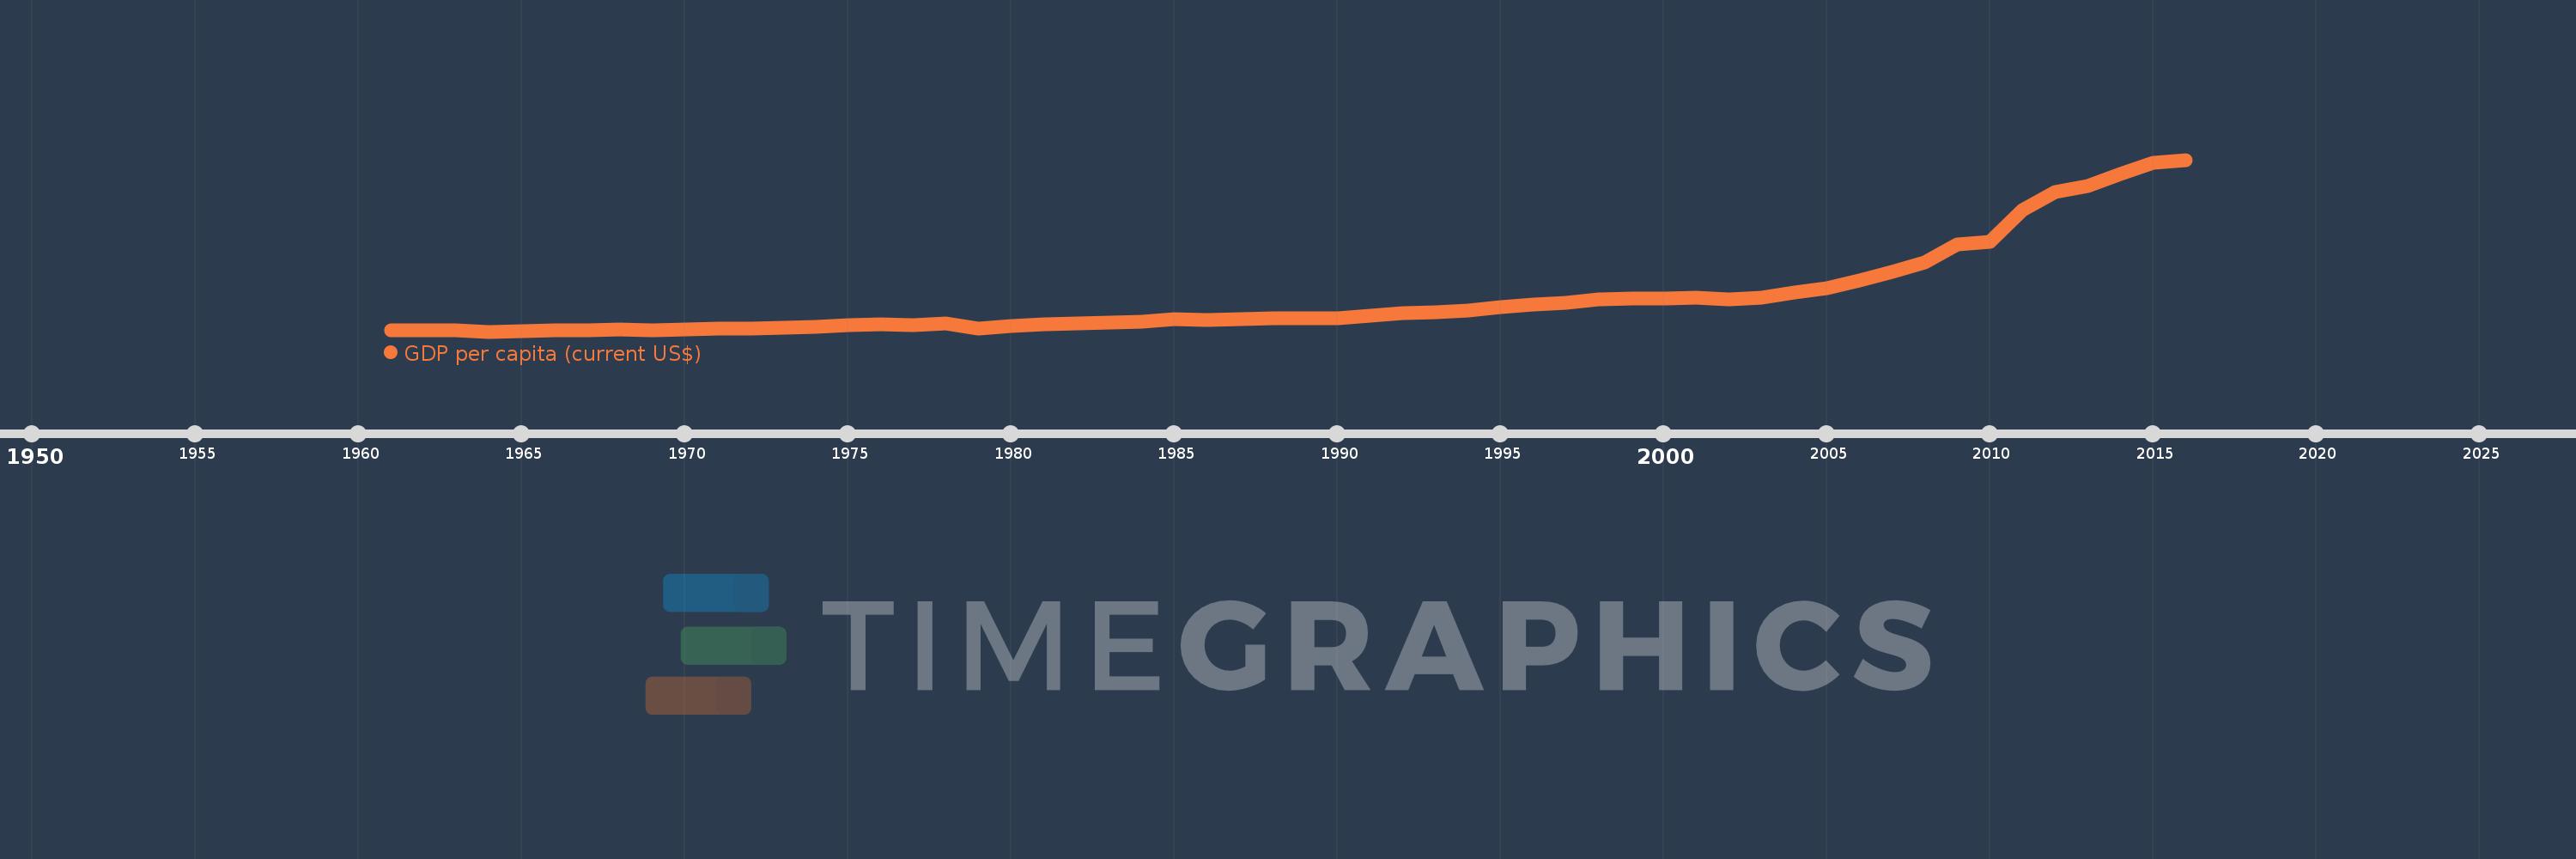
GDP per capita (current US$)
2016,2015,2014,2013,2012,2011,2010,2009,2008,2007,2006,2005,2004,2003,2002,2001,2000,1999,1998,1997,1996,1995,1994,1993,1992,1991,1990,1989,1988,1987,1986,1985,1984,1983,1982,1981,1980,1979,1978,1977,1976,1975,1974,1973,1972,1971,1970,1969,1968,1967,1966,1965,1964,1963,1962,1961
Queste statistiche in altri paesi:
AfghanistanAlbaniaAlgeriaAndorraAngolaAntigua and BarbudaArab WorldArgentinaArmeniaArubaAustraliaAustriaAzerbaijanBahamas, TheBahrainBangladeshBarbadosBelarusBelgiumBelizeBeninBermudaBhutanBoliviaBosnia and HerzegovinaBotswanaBrazilBrunei DarussalamBulgariaBurkina FasoBurundiCabo VerdeCambodiaCameroonCanadaCaribbean small statesCayman IslandsCentral African RepublicCentral Europe and the BalticsChadChannel IslandsChileChinaColombiaComorosCongo, Dem. Rep.Congo, Rep.Costa RicaCote d'IvoireCroatiaCubaCyprusCzech RepublicDenmarkDjiboutiDominicaDominican RepublicEarly-demographic dividendEast Asia & PacificEast Asia & Pacific (excluding high income)East Asia & Pacific (IDA & IBRD countries)EcuadorEgypt, Arab Rep.El SalvadorEquatorial GuineaEritreaEstoniaEthiopiaEuro areaEurope & Central AsiaEurope & Central Asia (excluding high income)Europe & Central Asia (IDA & IBRD countries)European UnionFaroe IslandsFijiFinlandFragile and conflict affected situationsFranceFrench PolynesiaGabonGambia, TheGeorgiaGermanyGhanaGreeceGreenlandGrenadaGuatemalaGuineaGuinea-BissauGuyanaHaitiHeavily indebted poor countries (HIPC)High incomeHondurasHong Kong SAR, ChinaHungaryIBRD onlyIcelandIDA & IBRD totalIDA blendIDA onlyIDA totalIndiaIndonesiaIran, Islamic Rep.IraqIrelandIsle of ManIsraelItalyJamaicaJapanJordanKazakhstanKenyaKiribatiKorea, Rep.KosovoKuwaitKyrgyz RepublicLao PDRLate-demographic dividendLatin America & Caribbean Latin America & Caribbean (excluding high income)Latin America & the Caribbean (IDA & IBRD countries)LatviaLeast developed countries: UN classificationLebanonLesothoLiberiaLibyaLiechtensteinLithuaniaLow & middle incomeLow incomeLower middle incomeLuxembourgMacao SAR, ChinaMacedonia, FYRMadagascarMalawiMalaysiaMaldivesMaliMaltaMarshall IslandsMauritaniaMauritiusMexicoMicronesia, Fed. Sts.Middle East & North AfricaMiddle East & North Africa (excluding high income)Middle East & North Africa (IDA & IBRD countries)Middle incomeMoldovaMonacoMongoliaMontenegroMoroccoMozambiqueMyanmarNamibiaNauruNepalNetherlandsNew CaledoniaNew ZealandNicaraguaNigerNigeriaNorth AmericaNorwayOECD membersOmanOther small statesPacific island small statesPakistanPalauPanamaPapua New GuineaParaguayPeruPhilippinesPolandPortugalPost-demographic dividendPre-demographic dividendPuerto RicoQatarRomaniaRussian FederationRwandaSamoaSan MarinoSao Tome and PrincipeSaudi ArabiaSenegalSerbiaSeychellesSierra LeoneSingaporeSlovak RepublicSloveniaSmall statesSolomon IslandsSomaliaSouth AfricaSouth AsiaSouth Asia (IDA & IBRD)South SudanSpainSri LankaSt. Kitts and NevisSt. LuciaSt. Vincent and the GrenadinesSub-Saharan Africa Sub-Saharan Africa (excluding high income)Sub-Saharan Africa (IDA & IBRD countries)SudanSurinameSwazilandSwedenSwitzerlandSyrian Arab RepublicTajikistanTanzaniaThailandTimor-LesteTogoTongaTrinidad and TobagoTunisiaTurkeyTurkmenistanTuvaluUgandaUkraineUnited Arab EmiratesUnited KingdomUnited StatesUpper middle incomeUruguayUzbekistanVanuatuVenezuela, RBVietnamVirgin Islands (U.S.)West Bank and GazaWorldYemen, Rep.ZambiaZimbabwe Linea del tempo:
Questa scala temporale mostra un grafico dal 1961 anno al 2016 anno. Sri Lanka. I dati fino ad 1960 anno non disponibili. Il numero di osservazioni attuali secondo i date: 56.
La fonte (nome):
Indicatori dello sviluppo mondiale
La fonte (organizzazione):
World Bank national accounts data, and OECD National Accounts data files.
Categorie:
Economy & Growth
sono stati aggiornati
23 apr 2017 anni
Indicatori delle variazioni dei valori per anni
Minima:
117.244
1 gen 1964 anni
Massimo:
3.926 Mille.
1 gen 2016 anni
Alla data di osservazione
Valore
Variazione assoluta
La variazione rispetto al valore precedente
1 gen 1961 anni
142.469
+142.469
0.0%
1 gen 1962 anni
142.046
-0.423
-0.3%
1 gen 1963 anni
137.332
-4.715
-3.32%
1 gen 1964 anni
117.244
-20.088
-14.63%
1 gen 1965 anni
120.127
+2.884
2.46%
1 gen 1966 anni
152.125
+31.997
26.64%
1 gen 1967 anni
153.114
+0.989
0.65%
1 gen 1968 anni
158.888
+5.774
3.77%
1 gen 1969 anni
150.212
-8.676
-5.46%
1 gen 1970 anni
160.427
+10.214
6.8%
1 gen 1971 anni
183.512
+23.086
14.39%
1 gen 1972 anni
186.707
+3.195
1.74%
1 gen 1973 anni
198.58
+11.873
6.36%
1 gen 1974 anni
219.664
+21.084
10.62%
1 gen 1975 anni
269.09
+49.425
22.5%
1 gen 1976 anni
280.92
+11.831
4.4%
1 gen 1977 anni
261.815
-19.105
-6.8%
1 gen 1978 anni
294.399
+32.584
12.45%
1 gen 1979 anni
192.613
-101.786
-34.57%
1 gen 1980 anni
232.491
+39.878
20.7%
1 gen 1981 anni
272.911
+40.42
17.39%
1 gen 1982 anni
297.423
+24.512
8.98%
1 gen 1983 anni
315.896
+18.473
6.21%
1 gen 1984 anni
336.913
+21.017
6.65%
1 gen 1985 anni
387.825
+50.912
15.11%
1 gen 1986 anni
377.643
-10.182
-2.63%
1 gen 1987 anni
398.26
+20.617
5.46%
1 gen 1988 anni
408.97
+10.711
2.69%
1 gen 1989 anni
420.561
+11.591
2.83%
1 gen 1990 anni
414.896
-5.665
-1.35%
1 gen 1991 anni
470.345
+55.449
13.36%
1 gen 1992 anni
520.072
+49.727
10.57%
1 gen 1993 anni
553.698
+33.627
6.47%
1 gen 1994 anni
583.184
+29.485
5.33%
1 gen 1995 anni
654.176
+70.993
12.17%
1 gen 1996 anni
720.908
+66.732
10.2%
1 gen 1997 anni
763.193
+42.284
5.87%
1 gen 1998 anni
823.66
+60.467
7.92%
1 gen 1999 anni
857.258
+33.598
4.08%
1 gen 2000 anni
844.827
-12.431
-1.45%
1 gen 2001 anni
875.412
+30.586
3.62%
1 gen 2002 anni
837.699
-37.713
-4.31%
1 gen 2003 anni
873.147
+35.448
4.23%
1 gen 2004 anni
989.455
+116.308
13.32%
1 gen 2005 anni
1.075 Mille.
+85.207
8.61%
1 gen 2006 anni
1.26 Mille.
+185.146
17.23%
1 gen 2007 anni
1.449 Mille.
+188.953
15.0%
1 gen 2008 anni
1.645 Mille.
+196.055
13.53%
1 gen 2009 anni
2.054 Mille.
+409.673
24.91%
1 gen 2010 anni
2.107 Mille.
+52.298
2.55%
1 gen 2011 anni
2.82 Mille.
+712.864
33.84%
1 gen 2012 anni
3.221 Mille.
+401.5
14.24%
1 gen 2013 anni
3.351 Mille.
+129.534
4.02%
1 gen 2014 anni
3.611 Mille.
+260.657
7.78%
1 gen 2015 anni
3.853 Mille.
+241.4
6.68%
1 gen 2016 anni
3.926 Mille.
+73.432
1.91%
Classificazione dei paesi secondo i statistiche attuali per anni


Commenti: