29
/it/
it
AIzaSyAYiBZKx7MnpbEhh9jyipgxe19OcubqV5w
April 1, 2024
248219
Spain
ESP
true
2
1
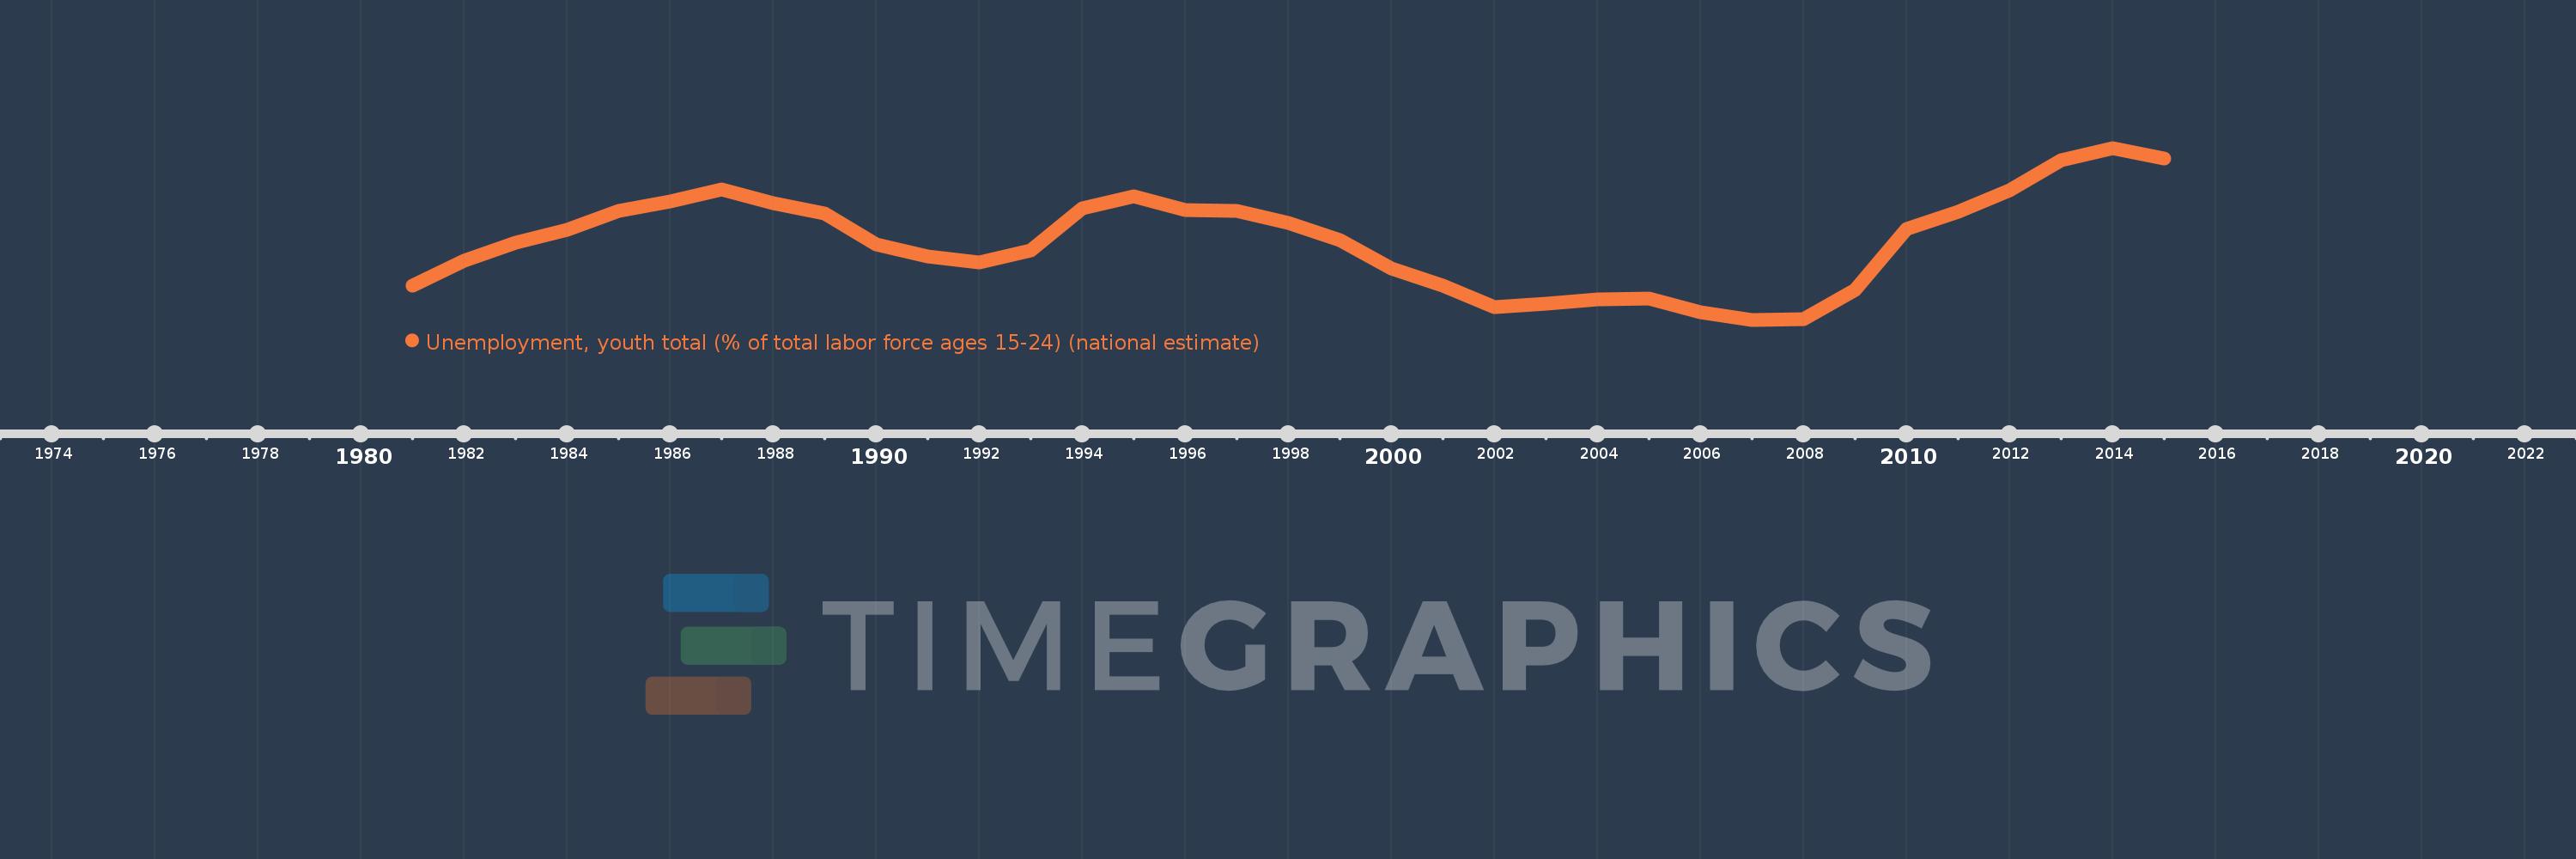
Unemployment, youth total (% of total labor force ages 15-24) (national estimate)
2015,2014,2013,2012,2011,2010,2009,2008,2007,2006,2005,2004,2003,2002,2001,2000,1999,1998,1997,1996,1995,1994,1993,1992,1991,1990,1989,1988,1987,1986,1985,1984,1983,1982,1981
Queste statistiche in altri paesi:
AlbaniaAlgeriaAmerican SamoaAntigua and BarbudaArab WorldArgentinaArmeniaArubaAustraliaAustriaAzerbaijanBahamas, TheBahrainBangladeshBarbadosBelarusBelgiumBelizeBeninBermudaBhutanBoliviaBosnia and HerzegovinaBotswanaBrazilBritish Virgin IslandsBulgariaBurkina FasoBurundiCabo VerdeCambodiaCameroonCanadaCaribbean small statesCayman IslandsCentral Europe and the BalticsChileColombiaCosta RicaCroatiaCubaCyprusCzech RepublicDenmarkDominicaDominican RepublicEarly-demographic dividendEcuadorEgypt, Arab Rep.El SalvadorEstoniaEthiopiaEuro areaEurope & Central AsiaEurope & Central Asia (excluding high income)Europe & Central Asia (IDA & IBRD countries)European UnionFaroe IslandsFijiFinlandFranceFrench PolynesiaGabonGambia, TheGeorgiaGermanyGhanaGreeceGrenadaGuamGuatemalaGuineaGuyanaHaitiHigh incomeHondurasHong Kong SAR, ChinaHungaryIcelandIDA blendIndiaIndonesiaIran, Islamic Rep.IrelandIsle of ManIsraelItalyJamaicaJapanJordanKazakhstanKiribatiKorea, Rep.KosovoKuwaitKyrgyz RepublicLao PDRLatin America & Caribbean Latin America & Caribbean (excluding high income)Latin America & the Caribbean (IDA & IBRD countries)LatviaLebanonLesothoLiberiaLibyaLithuaniaLower middle incomeLuxembourgMacao SAR, ChinaMacedonia, FYRMadagascarMalawiMalaysiaMaldivesMaliMaltaMarshall IslandsMauritiusMexicoMiddle East & North AfricaMiddle East & North Africa (excluding high income)Middle East & North Africa (IDA & IBRD countries)MoldovaMonacoMongoliaMontenegroMoroccoMozambiqueNamibiaNauruNepalNetherlandsNew ZealandNicaraguaNigerNigeriaNorth AmericaNorthern Mariana IslandsNorwayOECD membersPakistanPalauPanamaPapua New GuineaParaguayPeruPhilippinesPolandPortugalPost-demographic dividendPuerto RicoQatarRomaniaRussian FederationRwandaSamoaSan MarinoSao Tome and PrincipeSaudi ArabiaSenegalSerbiaSeychellesSierra LeoneSingaporeSlovak RepublicSloveniaSolomon IslandsSouth AfricaSouth AsiaSouth Asia (IDA & IBRD)South SudanSpainSri LankaSt. Kitts and NevisSt. LuciaSt. Vincent and the GrenadinesSudanSurinameSwazilandSwedenSwitzerlandSyrian Arab RepublicTajikistanTanzaniaThailandTimor-LesteTongaTrinidad and TobagoTunisiaTurkeyUgandaUkraineUnited Arab EmiratesUnited KingdomUnited StatesUruguayVanuatuVenezuela, RBVietnamWest Bank and GazaYemen, Rep.ZambiaZimbabwe Linea del tempo:
Questa scala temporale mostra un grafico dal 1981 anno al 2015 anno. Spain. I dati fino ad 1980 anno non disponibili. Il numero di osservazioni attuali secondo i date: 35.
La fonte (nome):
Indicatori dello sviluppo mondiale
La fonte (organizzazione):
International Labour Organization, Key Indicators of the Labour Market database.
Categorie:
Social Protection & Labor
sono stati aggiornati
23 apr 2017 anni
Indicatori delle variazioni dei valori per anni
Minima:
17.9
1 gen 2007 anni
Massimo:
55.5
1 gen 2014 anni
Alla data di osservazione
Valore
Variazione assoluta
La variazione rispetto al valore precedente
1 gen 1981 anni
25.3
+25.3
0.0%
1 gen 1982 anni
30.9
+5.6
22.13%
1 gen 1983 anni
34.7
+3.8
12.3%
1 gen 1984 anni
37.6
+2.9
8.36%
1 gen 1985 anni
41.8
+4.2
11.17%
1 gen 1986 anni
43.8
+2.0
4.78%
1 gen 1987 anni
46.5
+2.7
6.16%
1 gen 1988 anni
43.5
-3.0
-6.45%
1 gen 1989 anni
41.1
-2.4
-5.52%
1 gen 1990 anni
34.3
-6.8
-16.55%
1 gen 1991 anni
31.8
-2.5
-7.29%
1 gen 1992 anni
30.5
-1.3
-4.09%
1 gen 1993 anni
33.1
+2.6
8.52%
1 gen 1994 anni
42.2
+9.1
27.49%
1 gen 1995 anni
44.9
+2.7
6.4%
1 gen 1996 anni
41.9
-3.0
-6.68%
1 gen 1997 anni
41.8
-0.1
-0.24%
1 gen 1998 anni
39.1
-2.7
-6.46%
1 gen 1999 anni
35.4
-3.7
-9.46%
1 gen 2000 anni
29.1
-6.3
-17.8%
1 gen 2001 anni
25.3
-3.8
-13.06%
1 gen 2002 anni
20.7
-4.6
-18.18%
1 gen 2003 anni
21.5
+0.8
3.86%
1 gen 2004 anni
22.3
+0.8
3.72%
1 gen 2005 anni
22.5
+0.2
0.9%
1 gen 2006 anni
19.6
-2.9
-12.89%
1 gen 2007 anni
17.9
-1.7
-8.67%
1 gen 2008 anni
18.1
+0.2
1.12%
1 gen 2009 anni
24.5
+6.4
35.36%
1 gen 2010 anni
37.7
+13.2
53.88%
1 gen 2011 anni
41.5
+3.8
10.08%
1 gen 2012 anni
46.2
+4.7
11.33%
1 gen 2013 anni
52.9
+6.7
14.5%
1 gen 2014 anni
55.5
+2.6
4.91%
1 gen 2015 anni
53.2
-2.3
-4.14%
Classificazione dei paesi secondo i statistiche attuali per anni


Commenti: