29
/it/
it
AIzaSyAYiBZKx7MnpbEhh9jyipgxe19OcubqV5w
April 1, 2024
240810
Singapore
SGP
true
2
1
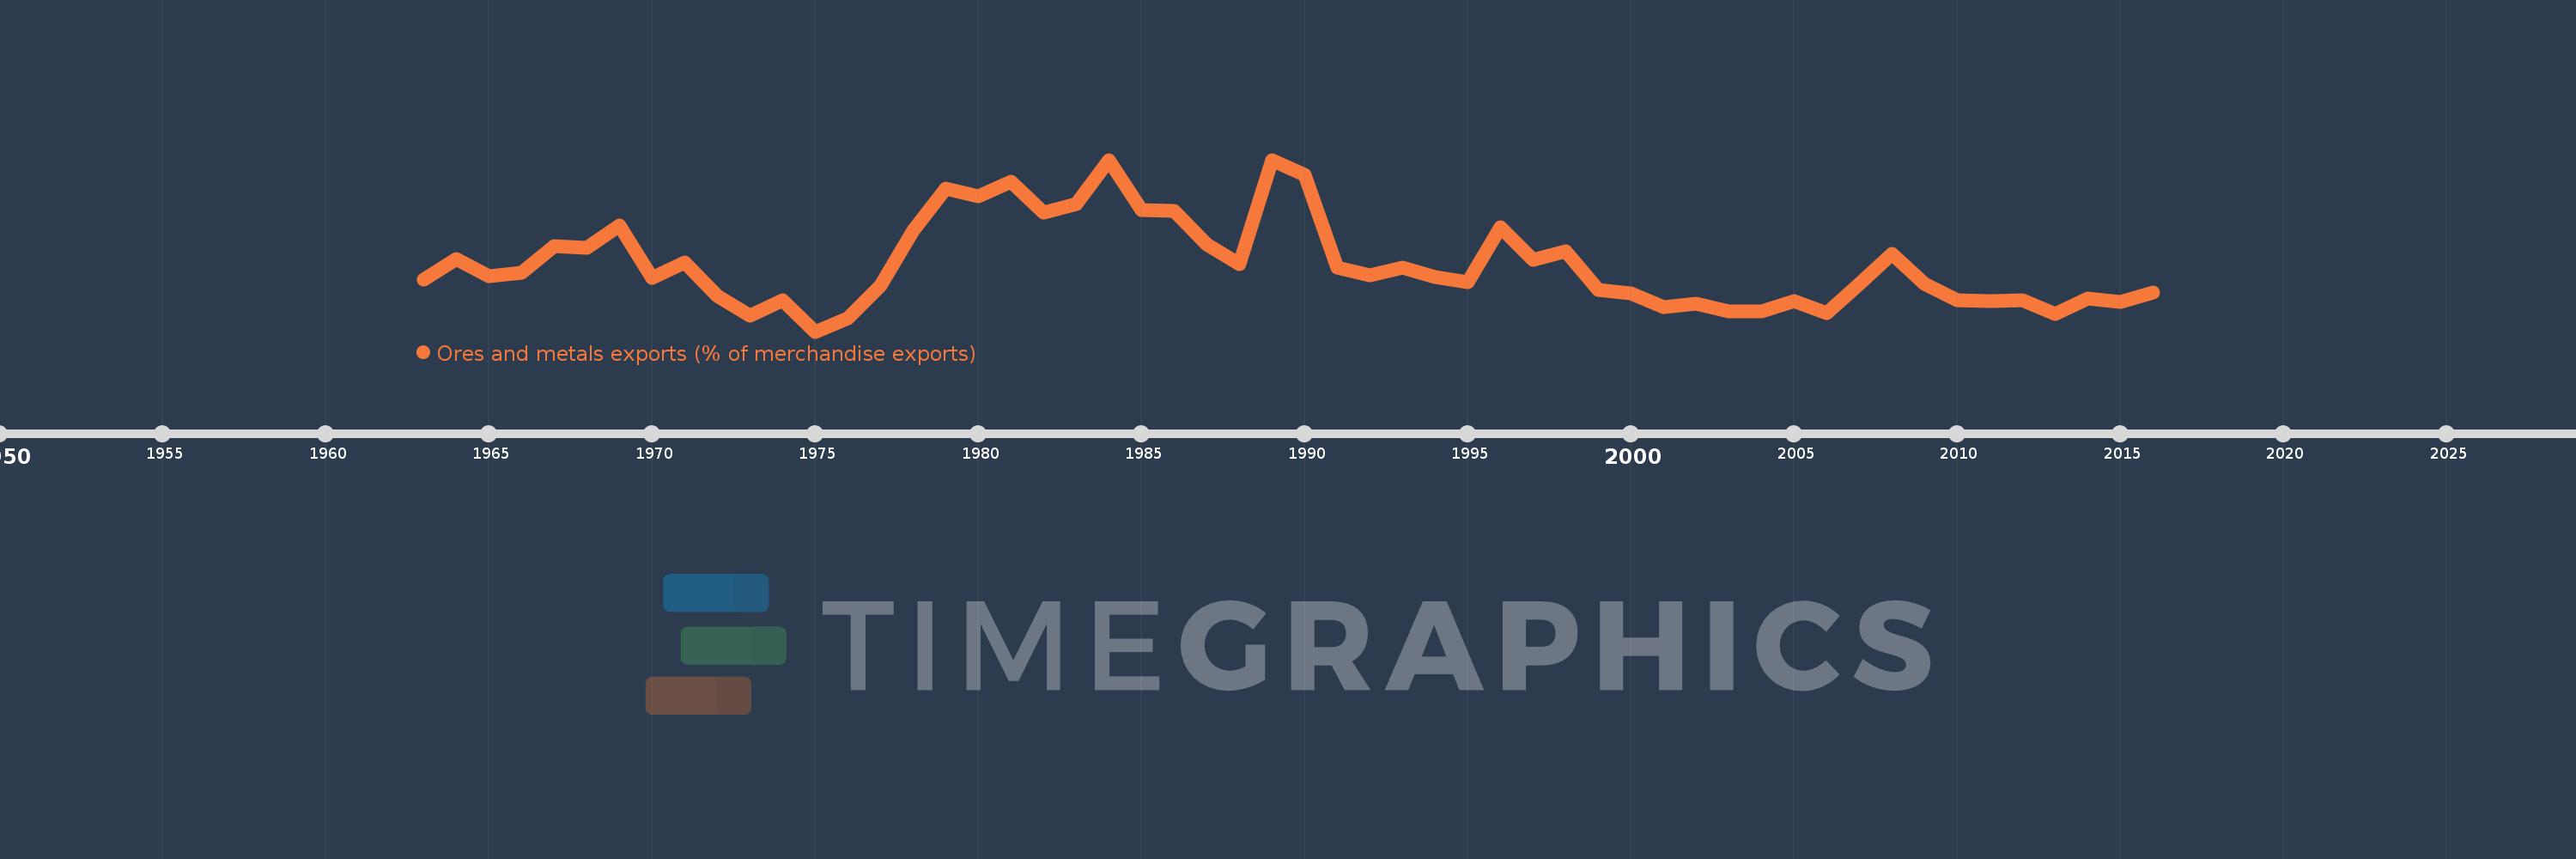
Ores and metals exports (% of merchandise exports)
2016,2015,2014,2013,2012,2011,2010,2009,2008,2007,2006,2005,2004,2003,2002,2001,2000,1999,1998,1997,1996,1995,1994,1993,1992,1991,1990,1989,1988,1987,1986,1985,1984,1983,1982,1981,1980,1979,1978,1977,1976,1975,1974,1973,1972,1971,1970,1969,1968,1967,1966,1965,1964,1963
Queste statistiche in altri paesi:
AfghanistanAlbaniaAlgeriaAndorraAngolaAntigua and BarbudaArab WorldArgentinaArmeniaArubaAustraliaAustriaAzerbaijanBahamas, TheBahrainBangladeshBarbadosBelarusBelgiumBelizeBeninBermudaBhutanBoliviaBosnia and HerzegovinaBotswanaBrazilBrunei DarussalamBulgariaBurkina FasoBurundiCabo VerdeCambodiaCameroonCanadaCaribbean small statesCayman IslandsCentral African RepublicCentral Europe and the BalticsChadChileChinaColombiaComorosCongo, Dem. Rep.Congo, Rep.Costa RicaCote d'IvoireCroatiaCubaCyprusCzech RepublicDenmarkDjiboutiDominicaDominican RepublicEarly-demographic dividendEast Asia & PacificEast Asia & Pacific (excluding high income)East Asia & Pacific (IDA & IBRD countries)EcuadorEgypt, Arab Rep.El SalvadorEquatorial GuineaEritreaEstoniaEthiopiaEuro areaEurope & Central AsiaEurope & Central Asia (excluding high income)Europe & Central Asia (IDA & IBRD countries)European UnionFaroe IslandsFijiFinlandFragile and conflict affected situationsFranceFrench PolynesiaGabonGambia, TheGeorgiaGermanyGhanaGreeceGreenlandGrenadaGuatemalaGuineaGuinea-BissauGuyanaHaitiHeavily indebted poor countries (HIPC)High incomeHondurasHong Kong SAR, ChinaHungaryIBRD onlyIcelandIDA & IBRD totalIDA blendIDA onlyIDA totalIndiaIndonesiaIran, Islamic Rep.IraqIrelandIsraelItalyJamaicaJapanJordanKazakhstanKenyaKiribatiKorea, Rep.KuwaitKyrgyz RepublicLao PDRLate-demographic dividendLatin America & Caribbean Latin America & Caribbean (excluding high income)Latin America & the Caribbean (IDA & IBRD countries)LatviaLeast developed countries: UN classificationLebanonLesothoLiberiaLibyaLithuaniaLow & middle incomeLower middle incomeLuxembourgMacao SAR, ChinaMacedonia, FYRMadagascarMalawiMalaysiaMaldivesMaliMaltaMauritaniaMauritiusMexicoMiddle East & North AfricaMiddle East & North Africa (excluding high income)Middle East & North Africa (IDA & IBRD countries)Middle incomeMoldovaMongoliaMoroccoMozambiqueMyanmarNamibiaNepalNetherlandsNew CaledoniaNew ZealandNicaraguaNigerNigeriaNorth AmericaNorwayOECD membersOmanOther small statesPacific island small statesPakistanPalauPanamaPapua New GuineaParaguayPeruPhilippinesPolandPortugalPost-demographic dividendPre-demographic dividendQatarRomaniaRussian FederationRwandaSamoaSao Tome and PrincipeSaudi ArabiaSenegalSerbiaSeychellesSierra LeoneSingaporeSlovak RepublicSloveniaSmall statesSolomon IslandsSomaliaSouth AfricaSouth AsiaSouth Asia (IDA & IBRD)SpainSri LankaSt. Kitts and NevisSt. LuciaSt. Vincent and the GrenadinesSub-Saharan Africa Sub-Saharan Africa (excluding high income)Sub-Saharan Africa (IDA & IBRD countries)SudanSurinameSwazilandSwedenSwitzerlandSyrian Arab RepublicTajikistanTanzaniaThailandTimor-LesteTogoTongaTrinidad and TobagoTunisiaTurkeyTurkmenistanTurks and Caicos IslandsUgandaUkraineUnited Arab EmiratesUnited KingdomUnited StatesUpper middle incomeUruguayVanuatuVenezuela, RBVietnamVirgin Islands (U.S.)WorldYemen, Rep.ZambiaZimbabwe Linea del tempo:
Questa scala temporale mostra un grafico dal 1963 anno al 2016 anno. Singapore. I dati fino ad 1962 anno non disponibili. Il numero di osservazioni attuali secondo i date: 54.
La fonte (nome):
Indicatori dello sviluppo mondiale
La fonte (organizzazione):
World Bank staff estimates from the Comtrade database maintained by the United Nations Statistics Division.
Categorie:
Energy & Mining, Private Sector, Trade
sono stati aggiornati
23 apr 2017 anni
Indicatori delle variazioni dei valori per anni
Minima:
0.879
1 gen 1975 anni
Massimo:
2.696
1 gen 1989 anni
Alla data di osservazione
Valore
Variazione assoluta
La variazione rispetto al valore precedente
1 gen 1963 anni
1.43
+1.43
0.0%
1 gen 1964 anni
1.648
+0.217
15.18%
1 gen 1965 anni
1.461
-0.187
-11.33%
1 gen 1966 anni
1.499
+0.038
2.58%
1 gen 1967 anni
1.781
+0.282
18.82%
1 gen 1968 anni
1.769
-0.012
-0.65%
1 gen 1969 anni
1.998
+0.229
12.95%
1 gen 1970 anni
1.445
-0.553
-27.69%
1 gen 1971 anni
1.608
+0.164
11.32%
1 gen 1972 anni
1.253
-0.356
-22.11%
1 gen 1973 anni
1.046
-0.207
-16.54%
1 gen 1974 anni
1.208
+0.162
15.54%
1 gen 1975 anni
0.879
-0.329
-27.25%
1 gen 1976 anni
1.023
+0.144
16.43%
1 gen 1977 anni
1.364
+0.341
33.35%
1 gen 1978 anni
1.946
+0.581
42.6%
1 gen 1979 anni
2.393
+0.447
22.97%
1 gen 1980 anni
2.309
-0.084
-3.51%
1 gen 1981 anni
2.461
+0.153
6.61%
1 gen 1982 anni
2.141
-0.321
-13.03%
1 gen 1983 anni
2.224
+0.084
3.9%
1 gen 1984 anni
2.691
+0.466
20.97%
1 gen 1985 anni
2.167
-0.524
-19.48%
1 gen 1986 anni
2.155
-0.011
-0.51%
1 gen 1987 anni
1.797
-0.358
-16.61%
1 gen 1988 anni
1.596
-0.201
-11.2%
1 gen 1989 anni
2.696
+1.1
68.89%
1 gen 1990 anni
2.534
-0.162
-6.0%
1 gen 1991 anni
1.553
-0.981
-38.7%
1 gen 1992 anni
1.475
-0.078
-5.03%
1 gen 1993 anni
1.557
+0.082
5.56%
1 gen 1994 anni
1.457
-0.1
-6.42%
1 gen 1995 anni
1.399
-0.058
-4.0%
1 gen 1996 anni
1.982
+0.583
41.68%
1 gen 1997 anni
1.642
-0.341
-17.19%
1 gen 1998 anni
1.728
+0.087
5.29%
1 gen 1999 anni
1.323
-0.406
-23.48%
1 gen 2000 anni
1.286
-0.036
-2.74%
1 gen 2001 anni
1.136
-0.151
-11.73%
1 gen 2002 anni
1.172
+0.037
3.25%
1 gen 2003 anni
1.096
-0.076
-6.5%
1 gen 2004 anni
1.092
-0.005
-0.42%
1 gen 2005 anni
1.198
+0.106
9.75%
1 gen 2006 anni
1.073
-0.125
-10.44%
1 gen 2007 anni
1.386
+0.313
29.16%
1 gen 2008 anni
1.7
+0.314
22.66%
1 gen 2009 anni
1.381
-0.319
-18.75%
1 gen 2010 anni
1.215
-0.166
-12.0%
1 gen 2011 anni
1.206
-0.01
-0.81%
1 gen 2012 anni
1.211
+0.006
0.46%
1 gen 2013 anni
1.068
-0.143
-11.8%
1 gen 2014 anni
1.231
+0.163
15.22%
1 gen 2015 anni
1.195
-0.036
-2.9%
1 gen 2016 anni
1.293
+0.098
8.18%
Classificazione dei paesi secondo i statistiche attuali per anni


Commenti: