29
/it/
it
AIzaSyAYiBZKx7MnpbEhh9jyipgxe19OcubqV5w
April 1, 2024
240443
Singapore
SGP
true
2
1
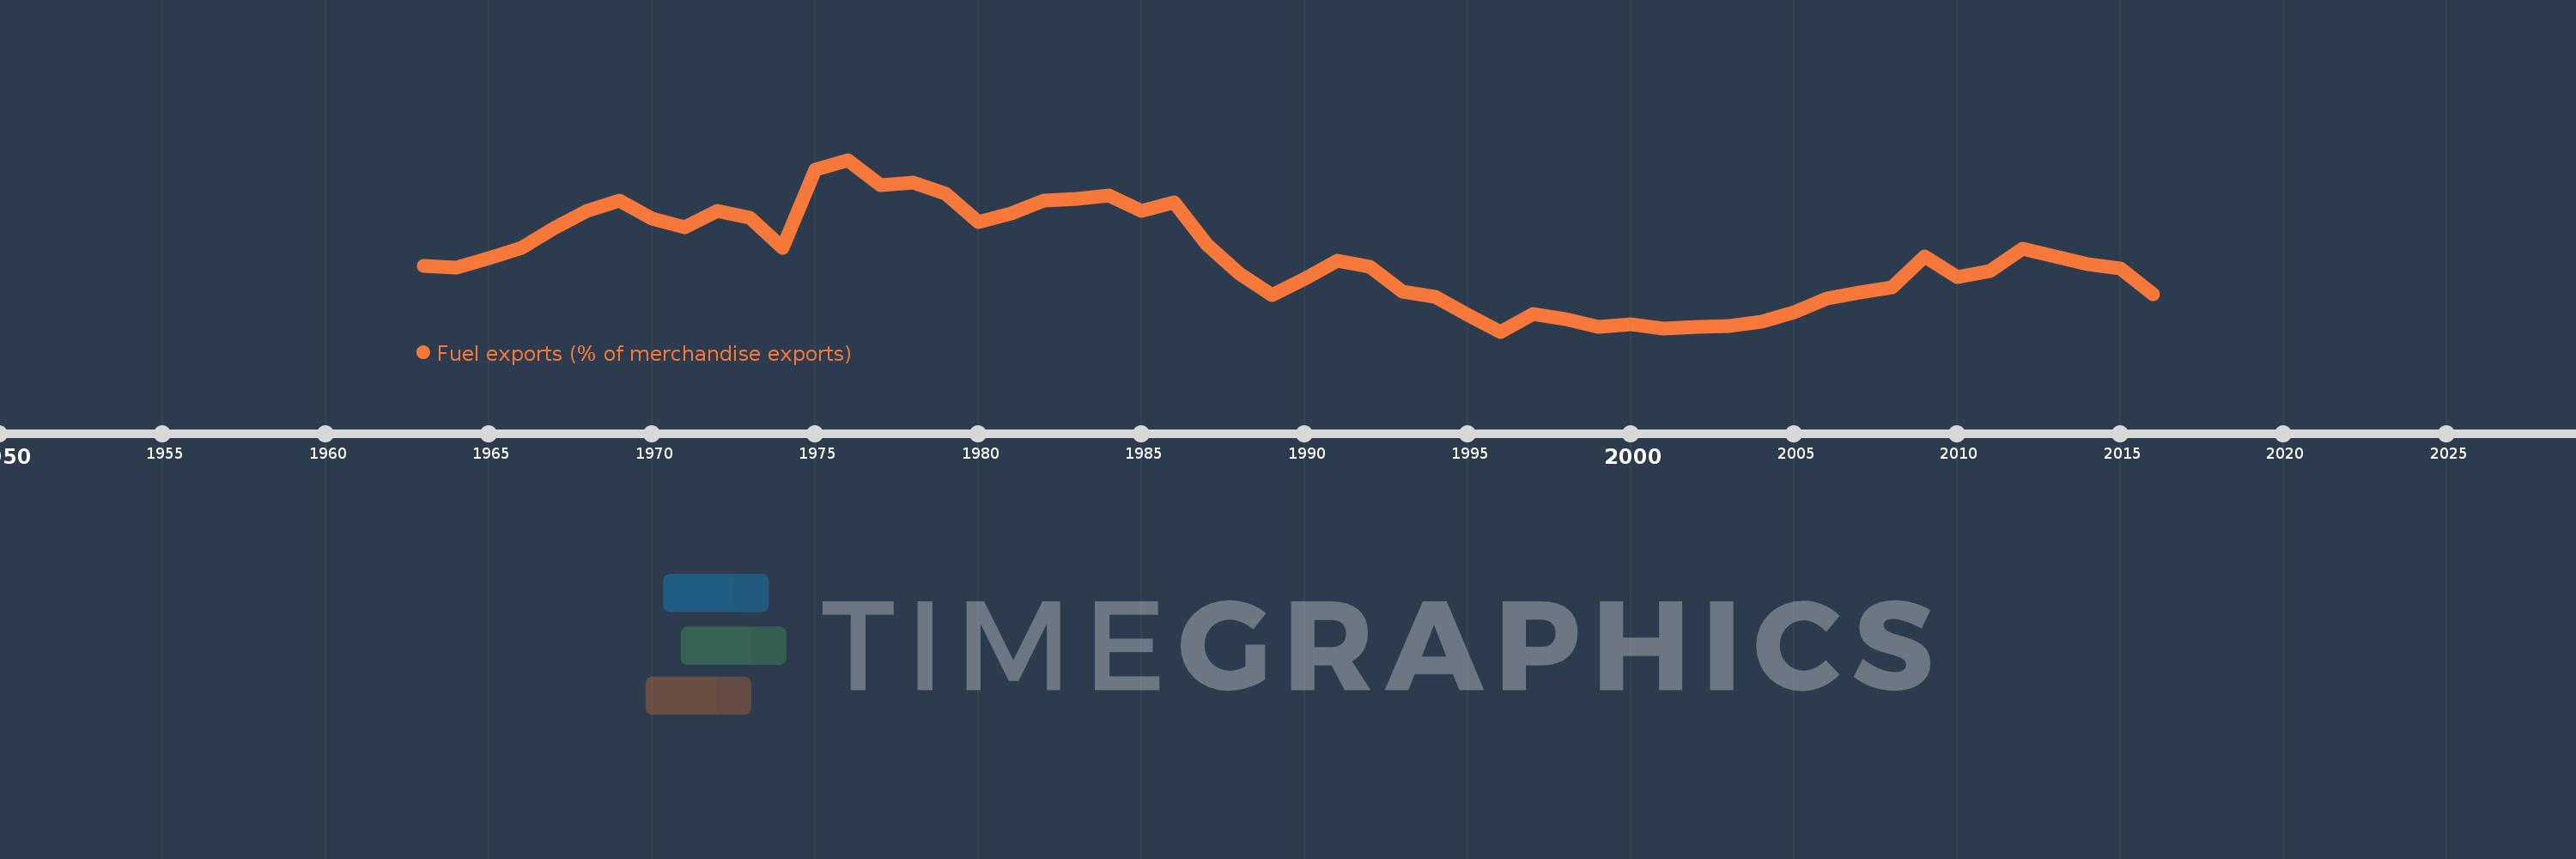
Fuel exports (% of merchandise exports)
2016,2015,2014,2013,2012,2011,2010,2009,2008,2007,2006,2005,2004,2003,2002,2001,2000,1999,1998,1997,1996,1995,1994,1993,1992,1991,1990,1989,1988,1987,1986,1985,1984,1983,1982,1981,1980,1979,1978,1977,1976,1975,1974,1973,1972,1971,1970,1969,1968,1967,1966,1965,1964,1963
Queste statistiche in altri paesi:
AfghanistanAlbaniaAlgeriaAndorraAngolaAntigua and BarbudaArab WorldArgentinaArmeniaArubaAustraliaAustriaAzerbaijanBahamas, TheBahrainBangladeshBarbadosBelarusBelgiumBelizeBeninBermudaBhutanBoliviaBosnia and HerzegovinaBotswanaBrazilBrunei DarussalamBulgariaBurkina FasoBurundiCabo VerdeCambodiaCameroonCanadaCaribbean small statesCayman IslandsCentral African RepublicCentral Europe and the BalticsChadChileChinaColombiaComorosCongo, Dem. Rep.Congo, Rep.Costa RicaCote d'IvoireCroatiaCubaCyprusCzech RepublicDenmarkDjiboutiDominicaDominican RepublicEarly-demographic dividendEast Asia & PacificEast Asia & Pacific (excluding high income)East Asia & Pacific (IDA & IBRD countries)EcuadorEgypt, Arab Rep.El SalvadorEquatorial GuineaEritreaEstoniaEthiopiaEuro areaEurope & Central AsiaEurope & Central Asia (excluding high income)Europe & Central Asia (IDA & IBRD countries)European UnionFaroe IslandsFijiFinlandFragile and conflict affected situationsFranceFrench PolynesiaGabonGambia, TheGeorgiaGermanyGhanaGreeceGreenlandGrenadaGuatemalaGuineaGuinea-BissauGuyanaHaitiHeavily indebted poor countries (HIPC)High incomeHondurasHong Kong SAR, ChinaHungaryIBRD onlyIcelandIDA & IBRD totalIDA blendIDA onlyIDA totalIndiaIndonesiaIran, Islamic Rep.IraqIrelandIsraelItalyJamaicaJapanJordanKazakhstanKenyaKiribatiKorea, Rep.KuwaitKyrgyz RepublicLao PDRLate-demographic dividendLatin America & Caribbean Latin America & Caribbean (excluding high income)Latin America & the Caribbean (IDA & IBRD countries)LatviaLeast developed countries: UN classificationLebanonLesothoLiberiaLibyaLithuaniaLow & middle incomeLower middle incomeLuxembourgMacao SAR, ChinaMacedonia, FYRMadagascarMalawiMalaysiaMaldivesMaliMaltaMauritaniaMauritiusMexicoMiddle East & North AfricaMiddle East & North Africa (excluding high income)Middle East & North Africa (IDA & IBRD countries)Middle incomeMoldovaMongoliaMoroccoMozambiqueMyanmarNamibiaNepalNetherlandsNew CaledoniaNew ZealandNicaraguaNigerNigeriaNorth AmericaNorwayOECD membersOmanOther small statesPacific island small statesPakistanPalauPanamaPapua New GuineaParaguayPeruPhilippinesPolandPortugalPost-demographic dividendPre-demographic dividendQatarRomaniaRussian FederationRwandaSamoaSao Tome and PrincipeSaudi ArabiaSenegalSerbiaSeychellesSierra LeoneSingaporeSlovak RepublicSloveniaSmall statesSolomon IslandsSomaliaSouth AfricaSouth AsiaSouth Asia (IDA & IBRD)SpainSri LankaSt. Kitts and NevisSt. LuciaSt. Vincent and the GrenadinesSub-Saharan Africa Sub-Saharan Africa (excluding high income)Sub-Saharan Africa (IDA & IBRD countries)SudanSurinameSwazilandSwedenSwitzerlandSyrian Arab RepublicTajikistanTanzaniaThailandTimor-LesteTogoTongaTrinidad and TobagoTunisiaTurkeyTurkmenistanTurks and Caicos IslandsTuvaluUgandaUkraineUnited Arab EmiratesUnited KingdomUnited StatesUpper middle incomeUruguayVanuatuVenezuela, RBVietnamVirgin Islands (U.S.)WorldYemen, Rep.ZambiaZimbabwe Linea del tempo:
Questa scala temporale mostra un grafico dal 1963 anno al 2016 anno. Singapore. I dati fino ad 1962 anno non disponibili. Il numero di osservazioni attuali secondo i date: 54.
La fonte (nome):
Indicatori dello sviluppo mondiale
La fonte (organizzazione):
World Bank staff estimates from the Comtrade database maintained by the United Nations Statistics Division.
Categorie:
Energy & Mining, Private Sector, Trade
sono stati aggiornati
23 apr 2017 anni
Indicatori delle variazioni dei valori per anni
Minima:
6.832
1 gen 1996 anni
Massimo:
33.638
1 gen 1976 anni
Alla data di osservazione
Valore
Variazione assoluta
La variazione rispetto al valore precedente
1 gen 1963 anni
17.103
+17.103
0.0%
1 gen 1964 anni
16.855
-0.249
-1.45%
1 gen 1965 anni
18.232
+1.377
8.17%
1 gen 1966 anni
19.922
+1.69
9.27%
1 gen 1967 anni
22.988
+3.066
15.39%
1 gen 1968 anni
25.712
+2.725
11.85%
1 gen 1969 anni
27.328
+1.616
6.28%
1 gen 1970 anni
24.408
-2.92
-10.68%
1 gen 1971 anni
23.177
-1.231
-5.04%
1 gen 1972 anni
25.723
+2.546
10.99%
1 gen 1973 anni
24.585
-1.138
-4.43%
1 gen 1974 anni
19.843
-4.742
-19.29%
1 gen 1975 anni
32.1
+12.257
61.77%
1 gen 1976 anni
33.638
+1.538
4.79%
1 gen 1977 anni
29.693
-3.945
-11.73%
1 gen 1978 anni
30.108
+0.415
1.4%
1 gen 1979 anni
28.288
-1.82
-6.04%
1 gen 1980 anni
23.957
-4.331
-15.31%
1 gen 1981 anni
25.198
+1.24
5.18%
1 gen 1982 anni
27.31
+2.112
8.38%
1 gen 1983 anni
27.537
+0.227
0.83%
1 gen 1984 anni
28.01
+0.474
1.72%
1 gen 1985 anni
25.617
-2.394
-8.55%
1 gen 1986 anni
26.981
+1.364
5.32%
1 gen 1987 anni
20.453
-6.527
-24.19%
1 gen 1988 anni
15.821
-4.633
-22.65%
1 gen 1989 anni
12.47
-3.351
-21.18%
1 gen 1990 anni
15.104
+2.634
21.12%
1 gen 1991 anni
17.853
+2.749
18.2%
1 gen 1992 anni
16.982
-0.87
-4.88%
1 gen 1993 anni
13.046
-3.936
-23.18%
1 gen 1994 anni
12.226
-0.819
-6.28%
1 gen 1995 anni
9.404
-2.823
-23.09%
1 gen 1996 anni
6.832
-2.572
-27.35%
1 gen 1997 anni
9.582
+2.75
40.25%
1 gen 1998 anni
8.788
-0.794
-8.29%
1 gen 1999 anni
7.533
-1.255
-14.28%
1 gen 2000 anni
7.912
+0.379
5.03%
1 gen 2001 anni
7.337
-0.575
-7.27%
1 gen 2002 anni
7.559
+0.222
3.03%
1 gen 2003 anni
7.702
+0.143
1.89%
1 gen 2004 anni
8.437
+0.735
9.54%
1 gen 2005 anni
9.832
+1.395
16.54%
1 gen 2006 anni
12.007
+2.175
22.12%
1 gen 2007 anni
12.93
+0.923
7.69%
1 gen 2008 anni
13.75
+0.819
6.34%
1 gen 2009 anni
18.498
+4.749
34.54%
1 gen 2010 anni
15.369
-3.129
-16.91%
1 gen 2011 anni
16.231
+0.862
5.61%
1 gen 2012 anni
19.777
+3.545
21.84%
1 gen 2013 anni
18.51
-1.267
-6.41%
1 gen 2014 anni
17.38
-1.13
-6.11%
1 gen 2015 anni
16.696
-0.684
-3.94%
1 gen 2016 anni
12.601
-4.095
-24.53%
Classificazione dei paesi secondo i statistiche attuali per anni


Commenti: