29
/it/
it
AIzaSyAYiBZKx7MnpbEhh9jyipgxe19OcubqV5w
April 1, 2024
231516
Rwanda
RWA
true
2
1
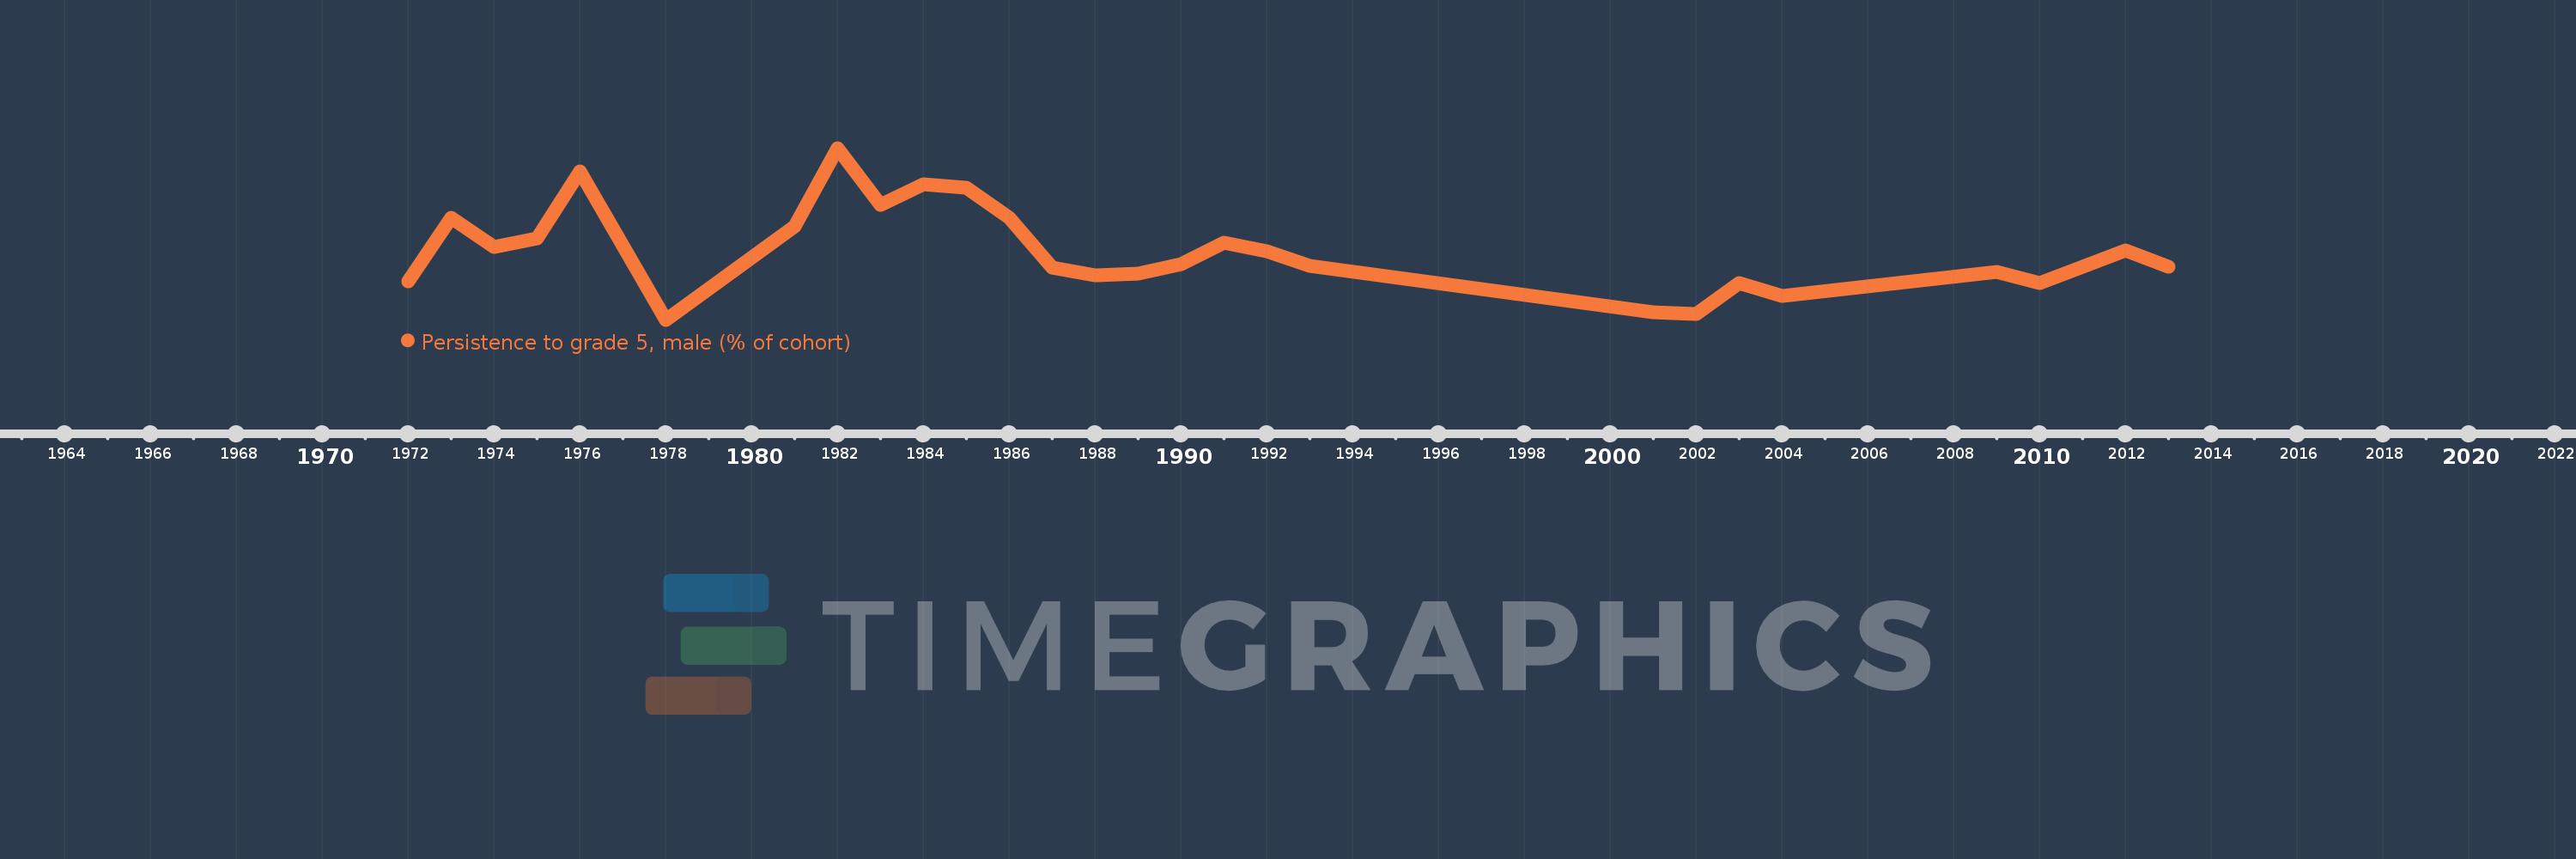
Persistence to grade 5, male (% of cohort)
2013,2012,2010,2009,2004,2003,2002,2001,1993,1992,1991,1990,1989,1988,1987,1986,1985,1984,1983,1982,1981,1978,1976,1975,1974,1973,1972
Queste statistiche in altri paesi:
AfghanistanAlbaniaAlgeriaAndorraAngolaAntigua and BarbudaArab WorldArgentinaArubaBahamas, TheBahrainBangladeshBarbadosBelgiumBelizeBeninBermudaBhutanBoliviaBosnia and HerzegovinaBotswanaBrunei DarussalamBurkina FasoBurundiCabo VerdeCambodiaCameroonCanadaCaribbean small statesCayman IslandsCentral African RepublicChadChileChinaColombiaComorosCongo, Dem. Rep.Congo, Rep.Costa RicaCote d'IvoireCubaCyprusCzech RepublicDenmarkDjiboutiDominicaDominican RepublicEarly-demographic dividendEast Asia & PacificEast Asia & Pacific (excluding high income)East Asia & Pacific (IDA & IBRD countries)EcuadorEgypt, Arab Rep.El SalvadorEquatorial GuineaEritreaEstoniaEthiopiaFijiFinlandFranceGabonGambia, TheGeorgiaGhanaGreeceGrenadaGuatemalaGuineaGuinea-BissauGuyanaHaitiHeavily indebted poor countries (HIPC)HondurasHong Kong SAR, ChinaHungaryIcelandIDA blendIDA onlyIDA totalIndiaIndonesiaIran, Islamic Rep.IraqIrelandIsraelItalyJamaicaJapanJordanKenyaKiribatiKorea, Rep.KuwaitLao PDRLate-demographic dividendLatviaLeast developed countries: UN classificationLebanonLesothoLiberiaLibyaLiechtensteinLow incomeLower middle incomeLuxembourgMacao SAR, ChinaMadagascarMalawiMalaysiaMaldivesMaliMaltaMarshall IslandsMauritaniaMauritiusMexicoMiddle East & North AfricaMiddle East & North Africa (excluding high income)Middle East & North Africa (IDA & IBRD countries)MontenegroMoroccoMozambiqueMyanmarNamibiaNepalNetherlandsNicaraguaNigerNigeriaNorwayOmanOther small statesPacific island small statesPakistanPanamaPapua New GuineaParaguayPeruPhilippinesPolandPortugalPre-demographic dividendQatarRwandaSamoaSan MarinoSao Tome and PrincipeSaudi ArabiaSenegalSeychellesSierra LeoneSingaporeSloveniaSolomon IslandsSouth AfricaSouth AsiaSouth Asia (IDA & IBRD)SpainSri LankaSt. Kitts and NevisSt. LuciaSt. Vincent and the GrenadinesSub-Saharan Africa Sub-Saharan Africa (excluding high income)Sub-Saharan Africa (IDA & IBRD countries)SudanSurinameSwazilandSwedenSwitzerlandSyrian Arab RepublicTanzaniaThailandTimor-LesteTogoTongaTrinidad and TobagoTunisiaTurkeyUgandaUnited Arab EmiratesUpper middle incomeUruguayVanuatuVenezuela, RBVietnamYemen, Rep.ZambiaZimbabwe Linea del tempo:
Questa scala temporale mostra un grafico dal 1972 anno al 2013 anno. Rwanda. I dati fino ad 1971 anno non disponibili. Il numero di osservazioni attuali secondo i date: 27.
La fonte (nome):
Indicatori dello sviluppo mondiale
La fonte (organizzazione):
United Nations Educational, Scientific, and Cultural Organization (UNESCO) Institute for Statistics.
Categorie:
Education, Gender
sono stati aggiornati
23 apr 2017 anni
Indicatori delle variazioni dei valori per anni
Minima:
39.709
1 gen 1978 anni
Massimo:
63.969
1 gen 1982 anni
Alla data di osservazione
Valore
Variazione assoluta
La variazione rispetto al valore precedente
1 gen 1972 anni
45.185
+45.185
0.0%
1 gen 1973 anni
54.072
+8.888
19.67%
1 gen 1974 anni
49.925
-4.147
-7.67%
1 gen 1975 anni
51.17
+1.245
2.49%
1 gen 1976 anni
60.673
+9.502
18.57%
1 gen 1978 anni
39.709
-20.964
-34.55%
1 gen 1981 anni
52.893
+13.184
33.2%
1 gen 1982 anni
63.969
+11.076
20.94%
1 gen 1983 anni
55.903
-8.066
-12.61%
1 gen 1984 anni
58.875
+2.972
5.32%
1 gen 1985 anni
58.374
-0.501
-0.85%
1 gen 1986 anni
54.105
-4.269
-7.31%
1 gen 1987 anni
47.091
-7.014
-12.96%
1 gen 1988 anni
46.037
-1.054
-2.24%
1 gen 1989 anni
46.183
+0.146
0.32%
1 gen 1990 anni
47.559
+1.376
2.98%
1 gen 1991 anni
50.62
+3.061
6.44%
1 gen 1992 anni
49.421
-1.199
-2.37%
1 gen 1993 anni
47.272
-2.149
-4.35%
1 gen 2001 anni
40.705
-6.567
-13.89%
1 gen 2002 anni
40.477
-0.228
-0.56%
1 gen 2003 anni
44.939
+4.462
11.02%
1 gen 2004 anni
43.034
-1.904
-4.24%
1 gen 2009 anni
46.412
+3.377
7.85%
1 gen 2010 anni
44.861
-1.551
-3.34%
1 gen 2012 anni
49.478
+4.617
10.29%
1 gen 2013 anni
47.226
-2.252
-4.55%
Classificazione dei paesi secondo i statistiche attuali per anni


Commenti: