29
/it/
it
AIzaSyAYiBZKx7MnpbEhh9jyipgxe19OcubqV5w
April 1, 2024
227148
Qatar
QAT
true
2
1
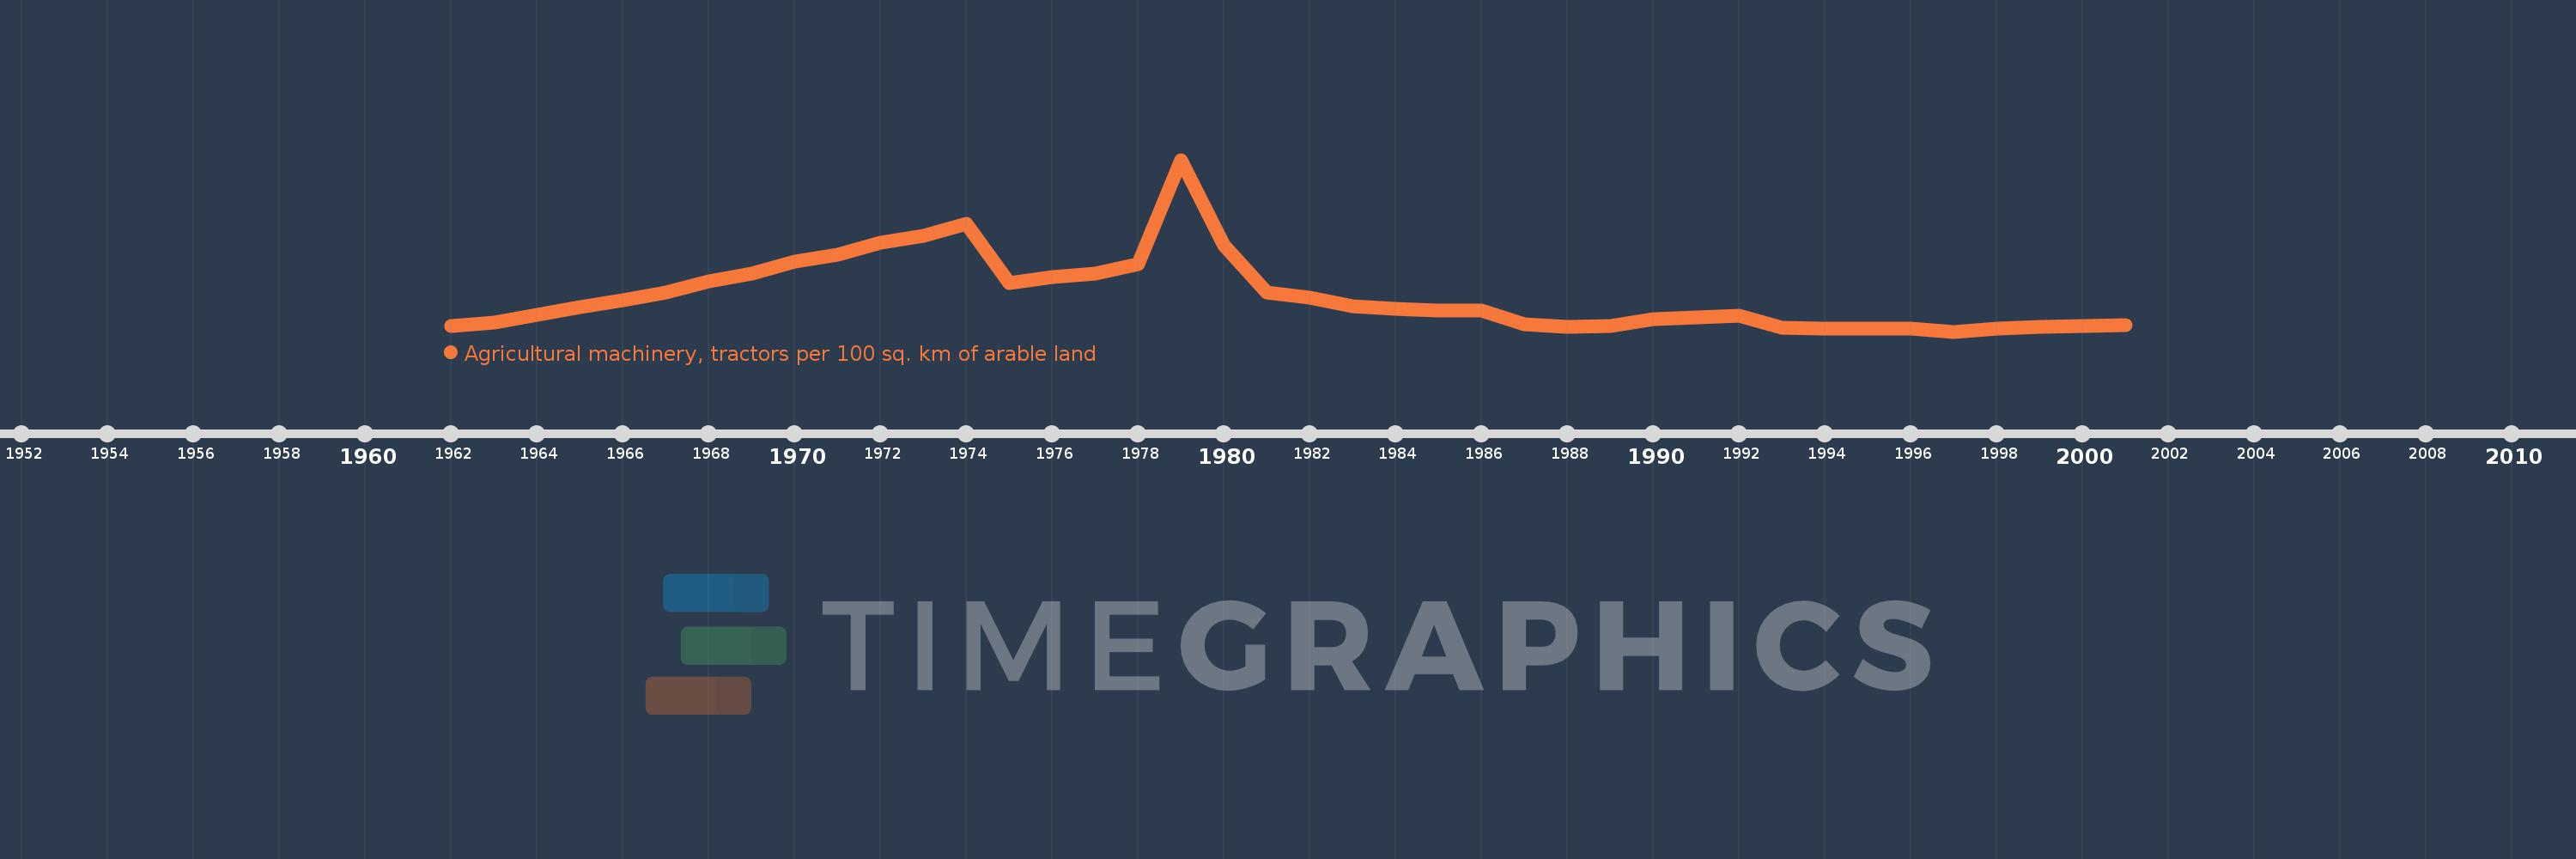
Agricultural machinery, tractors per 100 sq. km of arable land
2001,2000,1999,1998,1997,1996,1995,1994,1993,1992,1991,1990,1989,1988,1987,1986,1985,1984,1983,1982,1981,1980,1979,1978,1977,1976,1975,1974,1973,1972,1971,1970,1969,1968,1967,1966,1965,1964,1963,1962
Queste statistiche in altri paesi:
AfghanistanAlbaniaAlgeriaAmerican SamoaAndorraAngolaAntigua and BarbudaArab WorldArgentinaArmeniaAustraliaAustriaAzerbaijanBahamas, TheBahrainBangladeshBarbadosBelarusBelgiumBelizeBeninBermudaBhutanBoliviaBosnia and HerzegovinaBotswanaBrazilBritish Virgin IslandsBrunei DarussalamBulgariaBurkina FasoBurundiCabo VerdeCambodiaCameroonCanadaCaribbean small statesCentral African RepublicCentral Europe and the BalticsChadChileChinaColombiaCongo, Dem. Rep.Congo, Rep.Costa RicaCote d'IvoireCroatiaCubaCyprusCzech RepublicDenmarkDjiboutiDominicaDominican RepublicEarly-demographic dividendEast Asia & PacificEast Asia & Pacific (excluding high income)East Asia & Pacific (IDA & IBRD countries)EcuadorEgypt, Arab Rep.El SalvadorEritreaEstoniaEuro areaEurope & Central AsiaEurope & Central Asia (excluding high income)Europe & Central Asia (IDA & IBRD countries)European UnionFijiFinlandFragile and conflict affected situationsFranceFrench PolynesiaGambia, TheGeorgiaGermanyGhanaGreeceGrenadaGuamGuatemalaGuineaGuinea-BissauGuyanaHaitiHeavily indebted poor countries (HIPC)High incomeHondurasHungaryIBRD onlyIcelandIDA & IBRD totalIDA blendIDA onlyIDA totalIndiaIndonesiaIran, Islamic Rep.IraqIrelandIsraelItalyJamaicaJapanJordanKazakhstanKenyaKiribatiKorea, Dem. People’s Rep.Korea, Rep.KuwaitKyrgyz RepublicLao PDRLate-demographic dividendLatin America & Caribbean Latin America & Caribbean (excluding high income)Latin America & the Caribbean (IDA & IBRD countries)LatviaLeast developed countries: UN classificationLebanonLesothoLibyaLiechtensteinLithuaniaLow & middle incomeLow incomeLower middle incomeLuxembourgMacedonia, FYRMadagascarMalawiMalaysiaMaliMaltaMauritaniaMauritiusMexicoMiddle East & North AfricaMiddle East & North Africa (excluding high income)Middle East & North Africa (IDA & IBRD countries)Middle incomeMoldovaMongoliaMoroccoMozambiqueMyanmarNepalNetherlandsNew CaledoniaNew ZealandNicaraguaNigerNigeriaNorth AmericaNorthern Mariana IslandsNorwayOECD membersOmanOther small statesPakistanPanamaPapua New GuineaParaguayPeruPhilippinesPolandPortugalPost-demographic dividendPre-demographic dividendPuerto RicoQatarRomaniaRussian FederationRwandaSamoaSao Tome and PrincipeSaudi ArabiaSenegalSerbiaSeychellesSierra LeoneSlovak RepublicSloveniaSmall statesSolomon IslandsSomaliaSouth AfricaSouth AsiaSouth Asia (IDA & IBRD)SpainSri LankaSt. Kitts and NevisSt. LuciaSt. Vincent and the GrenadinesSub-Saharan Africa Sub-Saharan Africa (excluding high income)Sub-Saharan Africa (IDA & IBRD countries)SudanSurinameSwazilandSwedenSwitzerlandSyrian Arab RepublicTajikistanTanzaniaThailandTimor-LesteTogoTongaTrinidad and TobagoTunisiaTurkeyTurkmenistanUgandaUkraineUnited Arab EmiratesUnited KingdomUnited StatesUpper middle incomeUruguayVanuatuVenezuela, RBVietnamVirgin Islands (U.S.)West Bank and GazaWorldYemen, Rep.ZambiaZimbabwe Linea del tempo:
Questa scala temporale mostra un grafico dal 1962 anno al 2001 anno. Qatar. I dati fino ad 1961 anno non disponibili. Il numero di osservazioni attuali secondo i date: 40.
La fonte (nome):
Indicatori dello sviluppo mondiale
La fonte (organizzazione):
Food and Agriculture Organization, electronic files and web site.
Categorie:
Agriculture & Rural Development
sono stati aggiornati
23 apr 2017 anni
Indicatori delle variazioni dei valori per anni
Minima:
46.154
1 gen 1997 anni
Massimo:
500.0
1 gen 1979 anni
Alla data di osservazione
Valore
Variazione assoluta
La variazione rispetto al valore precedente
1 gen 1962 anni
60.0
+60.0
0.0%
1 gen 1963 anni
70.0
+10.0
16.67%
1 gen 1964 anni
90.0
+20.0
28.57%
1 gen 1965 anni
110.0
+20.0
22.22%
1 gen 1966 anni
130.0
+20.0
18.18%
1 gen 1967 anni
150.0
+20.0
15.38%
1 gen 1968 anni
180.0
+30.0
20.0%
1 gen 1969 anni
200.0
+20.0
11.11%
1 gen 1970 anni
230.0
+30.0
15.0%
1 gen 1971 anni
250.0
+20.0
8.7%
1 gen 1972 anni
280.0
+30.0
12.0%
1 gen 1973 anni
300.0
+20.0
7.14%
1 gen 1974 anni
330.0
+30.0
10.0%
1 gen 1975 anni
175.0
-155.0
-46.97%
1 gen 1976 anni
190.0
+15.0
8.57%
1 gen 1977 anni
200.0
+10.0
5.26%
1 gen 1978 anni
225.0
+25.0
12.5%
1 gen 1979 anni
500.0
+275.0
122.22%
1 gen 1980 anni
275.0
-225.0
-45.0%
1 gen 1981 anni
150.0
-125.0
-45.45%
1 gen 1982 anni
136.0
-14.0
-9.33%
1 gen 1983 anni
113.333
-22.667
-16.67%
1 gen 1984 anni
107.143
-6.19
-5.46%
1 gen 1985 anni
102.5
-4.643
-4.33%
1 gen 1986 anni
102.5
0.0
0.0%
1 gen 1987 anni
66.25
-36.25
-35.37%
1 gen 1988 anni
58.889
-7.361
-11.11%
1 gen 1989 anni
60.0
+1.111
1.89%
1 gen 1990 anni
80.0
+20.0
33.33%
1 gen 1991 anni
84.0
+4.0
5.0%
1 gen 1992 anni
87.778
+3.778
4.5%
1 gen 1993 anni
55.833
-31.944
-36.39%
1 gen 1994 anni
53.077
-2.756
-4.94%
1 gen 1995 anni
53.077
0.0
0.0%
1 gen 1996 anni
53.077
0.0
0.0%
1 gen 1997 anni
46.154
-6.923
-13.04%
1 gen 1998 anni
54.615
+8.462
18.33%
1 gen 1999 anni
57.692
+3.077
5.63%
1 gen 2000 anni
61.538
+3.846
6.67%
1 gen 2001 anni
63.077
+1.538
2.5%
Classificazione dei paesi secondo i statistiche attuali per anni


Commenti: