29
/it/
it
AIzaSyAYiBZKx7MnpbEhh9jyipgxe19OcubqV5w
April 1, 2024
222491
Peru
PER
true
2
1
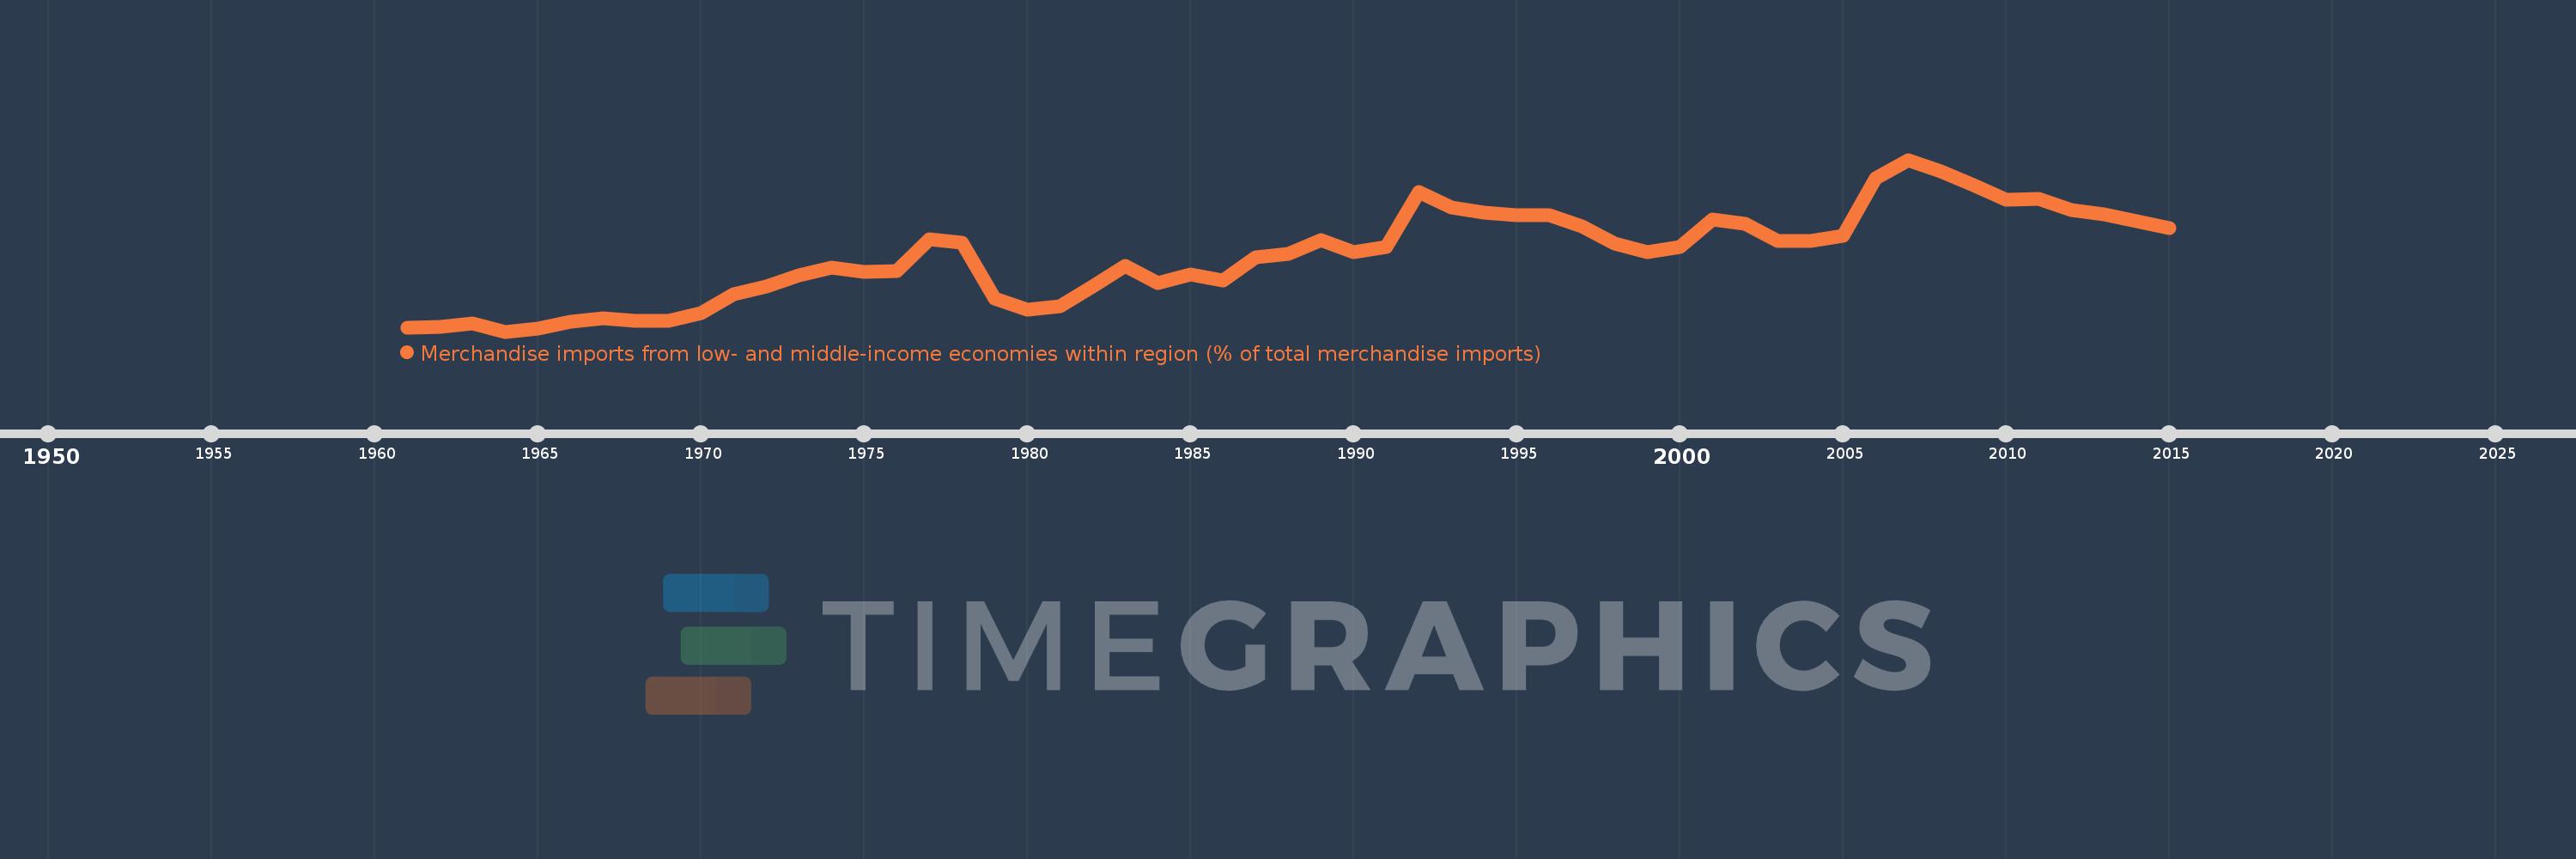
Merchandise imports from low- and middle-income economies within region (% of total merchandise imports)
2015,2014,2013,2012,2011,2010,2009,2008,2007,2006,2005,2004,2003,2002,2001,2000,1999,1998,1997,1996,1995,1994,1993,1992,1991,1990,1989,1988,1987,1986,1985,1984,1983,1982,1981,1980,1979,1978,1977,1976,1975,1974,1973,1972,1971,1970,1969,1968,1967,1966,1965,1964,1963,1962,1961
Queste statistiche in altri paesi:
Linea del tempo:
Questa scala temporale mostra un grafico dal 1961 anno al 2015 anno. Peru. I dati fino ad 1960 anno non disponibili. Il numero di osservazioni attuali secondo i date: 55.
La fonte (nome):
Indicatori dello sviluppo mondiale
La fonte (organizzazione):
World Bank staff estimates based data from International Monetary Fund's Direction of Trade database.
Categorie:
Private Sector, Trade
sono stati aggiornati
23 apr 2017 anni
Indicatori delle variazioni dei valori per anni
Minima:
1.688
1 gen 1964 anni
Massimo:
29.694
1 gen 2007 anni
Alla data di osservazione
Valore
Variazione assoluta
La variazione rispetto al valore precedente
1 gen 1961 anni
2.359
+2.359
0.0%
1 gen 1962 anni
2.518
+0.159
6.73%
1 gen 1963 anni
3.018
+0.5
19.87%
1 gen 1964 anni
1.688
-1.331
-44.08%
1 gen 1965 anni
2.177
+0.489
28.97%
1 gen 1966 anni
3.361
+1.184
54.4%
1 gen 1967 anni
3.879
+0.518
15.41%
1 gen 1968 anni
3.393
-0.486
-12.53%
1 gen 1969 anni
3.444
+0.051
1.5%
1 gen 1970 anni
4.646
+1.202
34.91%
1 gen 1971 anni
7.782
+3.136
67.48%
1 gen 1972 anni
9.052
+1.27
16.32%
1 gen 1973 anni
10.9
+1.848
20.42%
1 gen 1974 anni
12.14
+1.24
11.37%
1 gen 1975 anni
11.429
-0.71
-5.85%
1 gen 1976 anni
11.508
+0.079
0.69%
1 gen 1977 anni
16.778
+5.271
45.8%
1 gen 1978 anni
16.231
-0.547
-3.26%
1 gen 1979 anni
7.149
-9.083
-55.96%
1 gen 1980 anni
5.2
-1.949
-27.26%
1 gen 1981 anni
5.813
+0.613
11.79%
1 gen 1982 anni
9.047
+3.235
55.65%
1 gen 1983 anni
12.342
+3.295
36.42%
1 gen 1984 anni
9.623
-2.719
-22.03%
1 gen 1985 anni
11.03
+1.407
14.62%
1 gen 1986 anni
10.021
-1.009
-9.15%
1 gen 1987 anni
13.799
+3.778
37.7%
1 gen 1988 anni
14.426
+0.627
4.54%
1 gen 1989 anni
16.581
+2.155
14.94%
1 gen 1990 anni
14.607
-1.974
-11.91%
1 gen 1991 anni
15.464
+0.857
5.87%
1 gen 1992 anni
24.508
+9.044
58.48%
1 gen 1993 anni
21.983
-2.525
-10.3%
1 gen 1994 anni
21.02
-0.963
-4.38%
1 gen 1995 anni
20.678
-0.342
-1.63%
1 gen 1996 anni
20.617
-0.061
-0.3%
1 gen 1997 anni
18.858
-1.759
-8.53%
1 gen 1998 anni
16.036
-2.822
-14.97%
1 gen 1999 anni
14.664
-1.372
-8.56%
1 gen 2000 anni
15.445
+0.781
5.33%
1 gen 2001 anni
20.013
+4.568
29.57%
1 gen 2002 anni
19.285
-0.728
-3.64%
1 gen 2003 anni
16.524
-2.761
-14.32%
1 gen 2004 anni
16.498
-0.026
-0.16%
1 gen 2005 anni
17.338
+0.84
5.09%
1 gen 2006 anni
26.736
+9.398
54.21%
1 gen 2007 anni
29.694
+2.958
11.06%
1 gen 2008 anni
27.797
-1.897
-6.39%
1 gen 2009 anni
25.558
-2.239
-8.06%
1 gen 2010 anni
23.139
-2.419
-9.46%
1 gen 2011 anni
23.341
+0.202
0.87%
1 gen 2012 anni
21.483
-1.858
-7.96%
1 gen 2013 anni
20.735
-0.747
-3.48%
1 gen 2014 anni
19.703
-1.033
-4.98%
1 gen 2015 anni
18.498
-1.205
-6.12%
Classificazione dei paesi secondo i statistiche attuali per anni


Commenti: