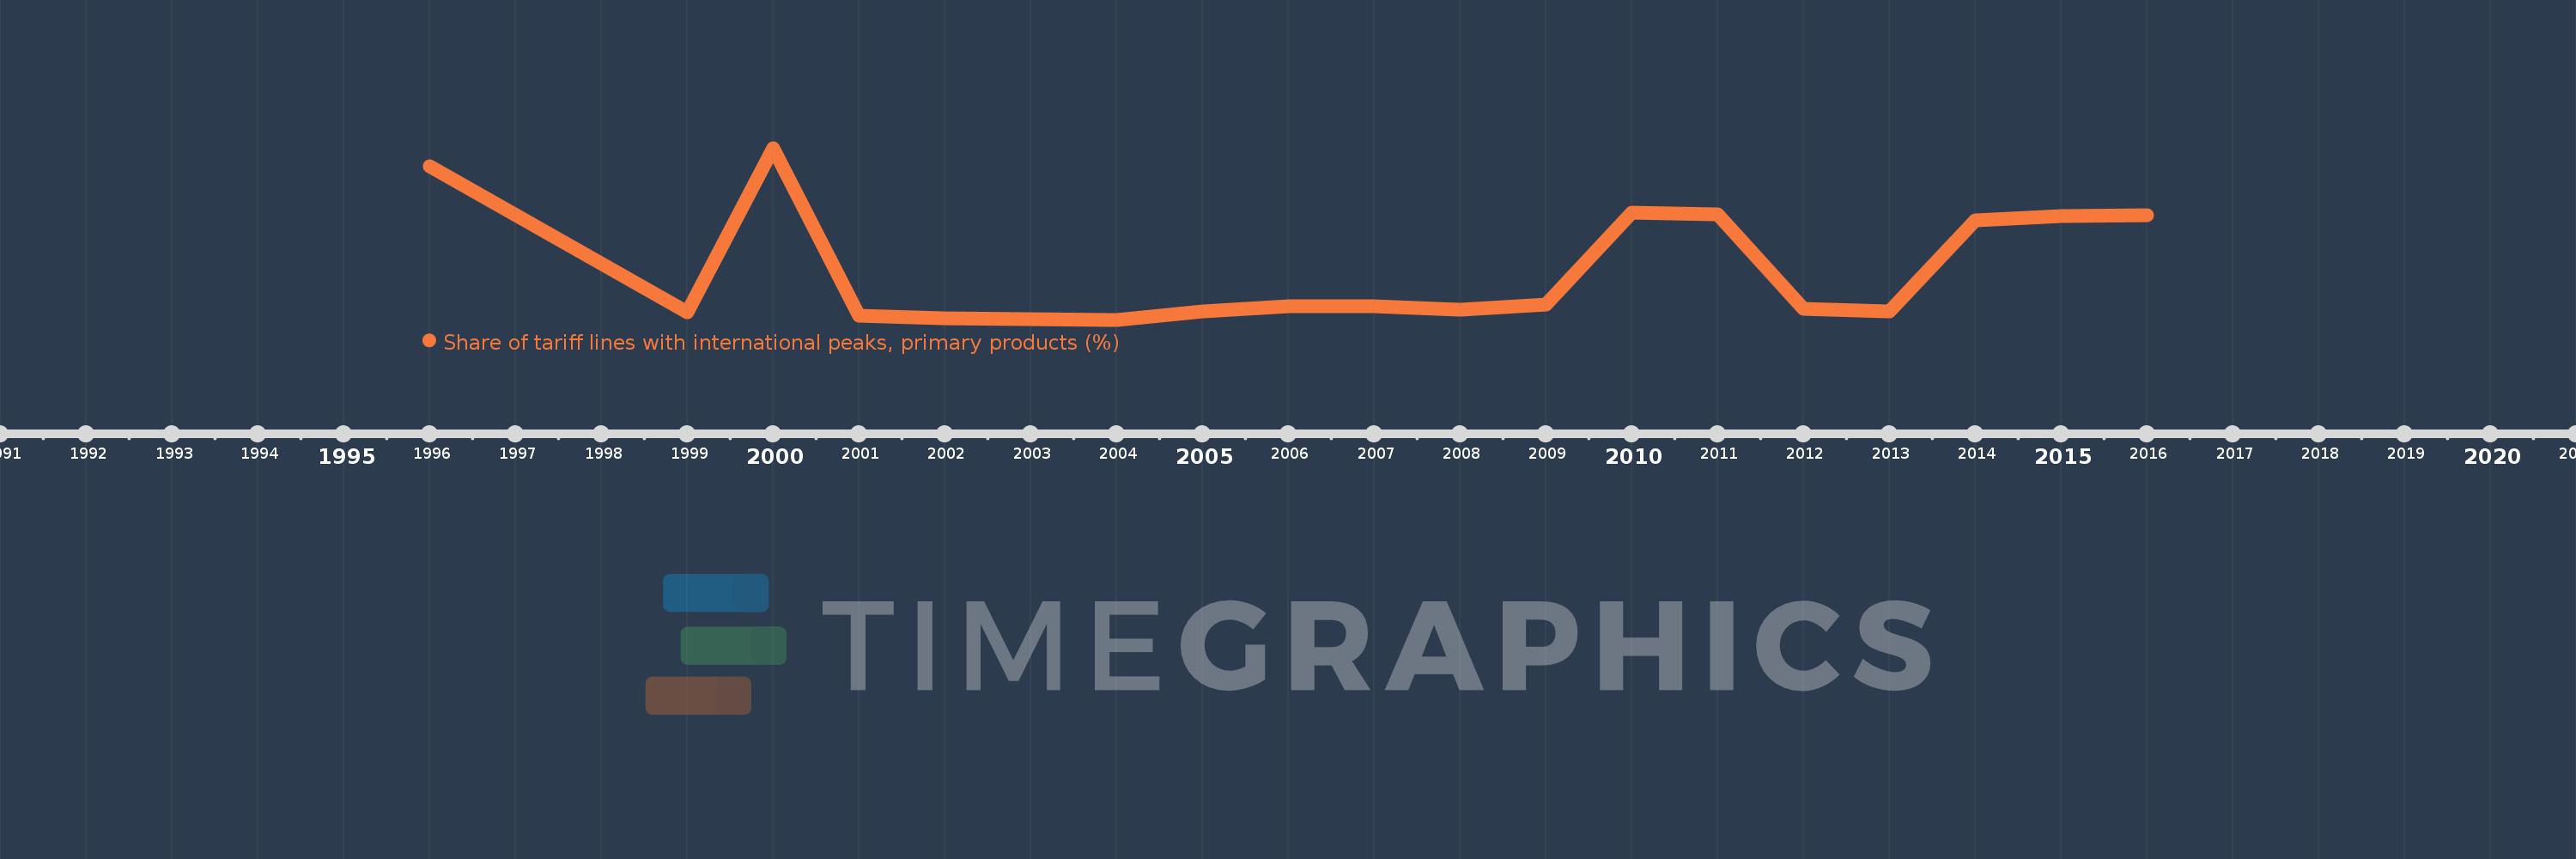
Questa scala temporale mostra un grafico dal 1996 anno al 2016 anno. Nicaragua. I dati fino ad 1995 anno non disponibili. Il numero di osservazioni attuali secondo i date: 19.
La fonte (nome):
Indicatori dello sviluppo mondiale
La fonte (organizzazione):
World Bank staff estimates using the World Integrated Trade Solution system, based on data from United Nations Conference on Trade and Development's Trade Analysis and Information System (TRAINS) database.
Categorie:
Private Sector, Trade
sono stati aggiornati
23 apr 2017 anni
Indicatori delle variazioni dei valori per anni
In media:
11.149
Minima:
1.164
1 gen 2004 anni
Massimo:
35.861
1 gen 2000 anni
Alla data di osservazione
Valore
Variazione assoluta
La variazione rispetto al valore precedente
1 gen 1996 anni
32.144
+32.144
0.0%
1 gen 1999 anni
2.718
-29.426
-91.54%
1 gen 2000 anni
35.861
+33.142
1.22 Mille.%
1 gen 2001 anni
1.909
-33.952
-94.68%
1 gen 2002 anni
1.508
-0.401
-21.0%
1 gen 2003 anni
1.286
-0.222
-14.72%
1 gen 2004 anni
1.164
-0.122
-9.5%
1 gen 2005 anni
2.828
+1.664
142.99%
1 gen 2006 anni
3.967
+1.139
40.29%
1 gen 2007 anni
3.899
-0.068
-1.72%
1 gen 2008 anni
3.21
-0.689
-17.66%
1 gen 2009 anni
4.222
+1.012
31.53%
1 gen 2010 anni
22.799
+18.577
439.96%
1 gen 2011 anni
22.51
-0.29
-1.27%
1 gen 2012 anni
3.43
-19.08
-84.76%
1 gen 2013 anni
2.782
-0.648
-18.9%
1 gen 2014 anni
21.273
+18.491
664.78%
1 gen 2015 anni
22.1
+0.827
3.89%
1 gen 2016 anni
22.228
+0.129
0.58%
Classificazione dei paesi secondo i statistiche attuali per anni
