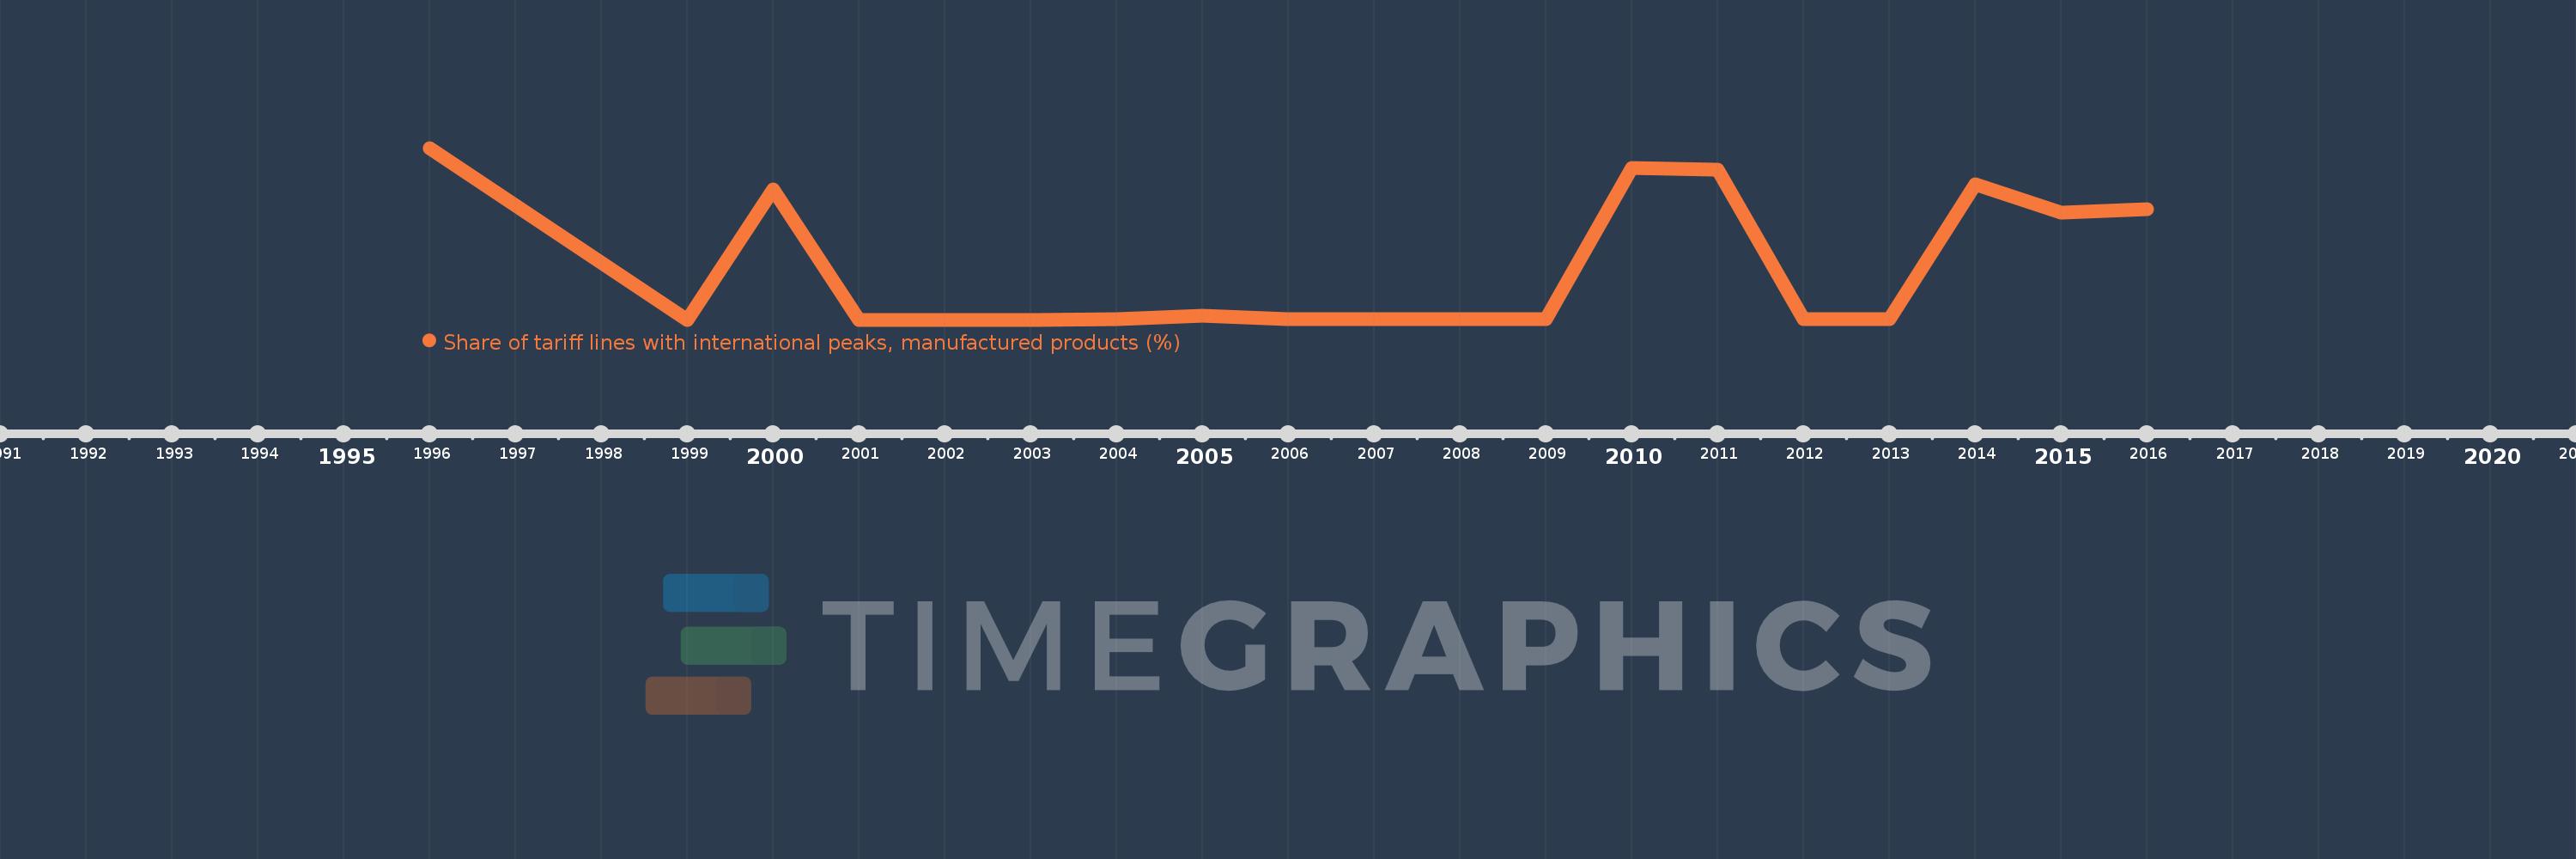
Questa scala temporale mostra un grafico dal 1996 anno al 2016 anno. Nicaragua. I dati fino ad 1995 anno non disponibili. Il numero di osservazioni attuali secondo i date: 19.
La fonte (nome):
Indicatori dello sviluppo mondiale
La fonte (organizzazione):
World Bank staff estimates using the World Integrated Trade Solution system, based on data from United Nations Conference on Trade and Development's Trade Analysis and Information System (TRAINS) database.
Categorie:
Private Sector, Trade
sono stati aggiornati
23 apr 2017 anni
Indicatori delle variazioni dei valori per anni
In media:
5.552
Minima:
0.0
1 gen 1999 anni
Massimo:
18.786
1 gen 1996 anni
Alla data di osservazione
Valore
Variazione assoluta
La variazione rispetto al valore precedente
1 gen 1996 anni
18.786
+18.786
0.0%
1 gen 1999 anni
0.0
-18.786
-100.0%
1 gen 2000 anni
14.267
+14.267
%
1 gen 2001 anni
0.0
-14.267
-100.0%
1 gen 2002 anni
0.0
0.0
%
1 gen 2003 anni
0.0
0.0
%
1 gen 2004 anni
0.029
+0.029
%
1 gen 2005 anni
0.472
+0.444
1.56 Mille.%
1 gen 2006 anni
0.031
-0.441
-93.37%
1 gen 2007 anni
0.025
-0.007
-21.65%
1 gen 2008 anni
0.02
-0.004
-17.97%
1 gen 2009 anni
0.034
+0.014
67.17%
1 gen 2010 anni
16.618
+16.584
49.29 Mille.%
1 gen 2011 anni
16.414
-0.204
-1.23%
1 gen 2012 anni
0.056
-16.358
-99.66%
1 gen 2013 anni
0.057
+0.001
2.48%
1 gen 2014 anni
14.811
+14.754
25.84 Mille.%
1 gen 2015 anni
11.76
-3.051
-20.6%
1 gen 2016 anni
12.116
+0.356
3.02%
Classificazione dei paesi secondo i statistiche attuali per anni
