29
/it/
it
AIzaSyAYiBZKx7MnpbEhh9jyipgxe19OcubqV5w
April 1, 2024
210294
Nicaragua
NIC
true
2
1
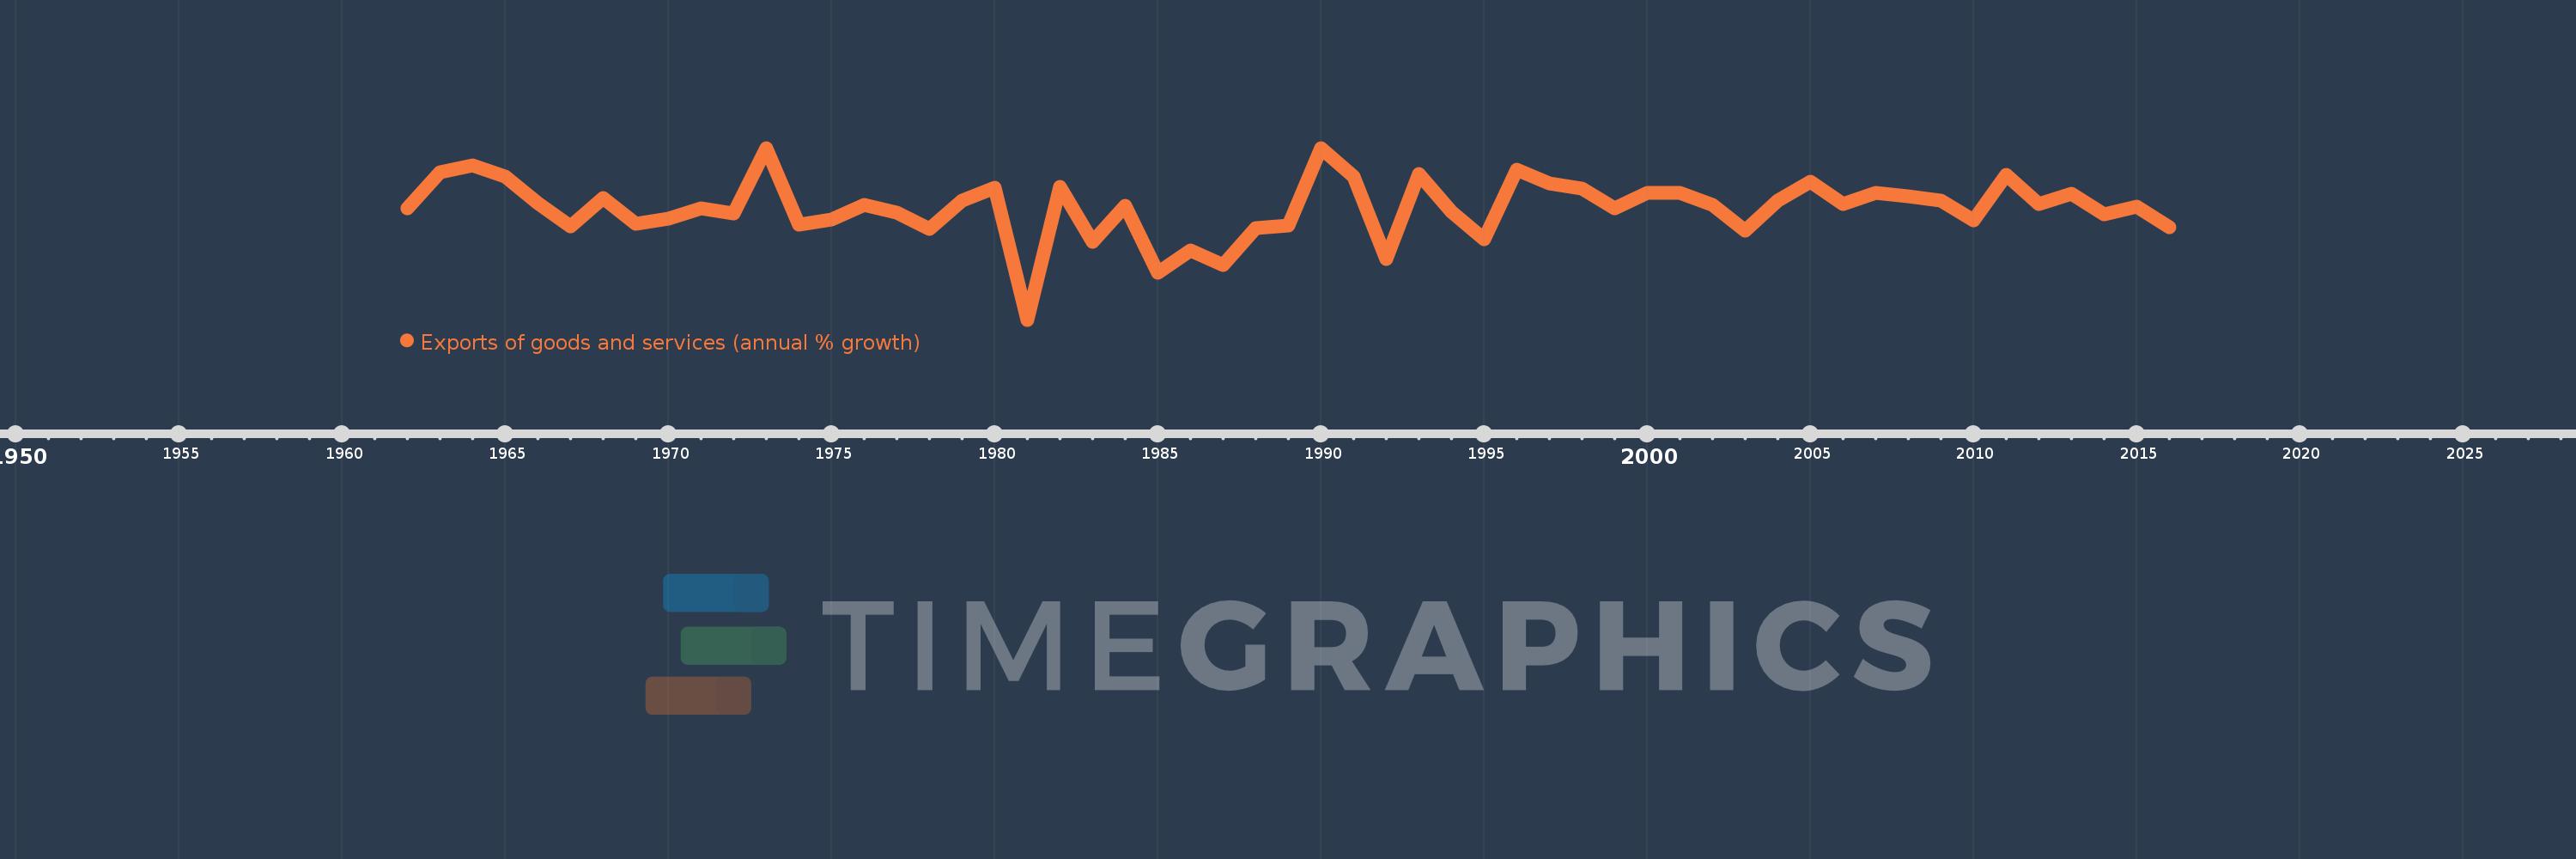
Exports of goods and services (annual % growth)
2016,2015,2014,2013,2012,2011,2010,2009,2008,2007,2006,2005,2004,2003,2002,2001,2000,1999,1998,1997,1996,1995,1994,1993,1992,1991,1990,1989,1988,1987,1986,1985,1984,1983,1982,1981,1980,1979,1978,1977,1976,1975,1974,1973,1972,1971,1970,1969,1968,1967,1966,1965,1964,1963,1962
Queste statistiche in altri paesi:
AlbaniaAlgeriaAngolaAntigua and BarbudaArab WorldArgentinaArmeniaAustraliaAustriaAzerbaijanBahamas, TheBahrainBangladeshBarbadosBelarusBelgiumBelizeBeninBhutanBoliviaBosnia and HerzegovinaBotswanaBrazilBrunei DarussalamBulgariaBurkina FasoBurundiCabo VerdeCambodiaCameroonCanadaCaribbean small statesCentral Europe and the BalticsChadChileColombiaComorosCongo, Dem. Rep.Congo, Rep.Costa RicaCote d'IvoireCroatiaCubaCyprusCzech RepublicDenmarkDjiboutiDominican RepublicEarly-demographic dividendEast Asia & PacificEcuadorEgypt, Arab Rep.El SalvadorEquatorial GuineaEritreaEstoniaEthiopiaEuro areaEurope & Central AsiaEurope & Central Asia (excluding high income)Europe & Central Asia (IDA & IBRD countries)European UnionFijiFinlandFranceGabonGambia, TheGeorgiaGermanyGhanaGreeceGuatemalaGuineaGuinea-BissauHaitiHeavily indebted poor countries (HIPC)High incomeHondurasHong Kong SAR, ChinaHungaryIBRD onlyIcelandIDA & IBRD totalIDA blendIDA onlyIDA totalIndiaIndonesiaIran, Islamic Rep.IrelandIsraelItalyJamaicaJapanJordanKazakhstanKenyaKorea, Rep.KosovoKuwaitKyrgyz RepublicLao PDRLatin America & Caribbean Latin America & Caribbean (excluding high income)Latin America & the Caribbean (IDA & IBRD countries)LatviaLebanonLiberiaLibyaLithuaniaLow & middle incomeLow incomeLower middle incomeLuxembourgMacao SAR, ChinaMacedonia, FYRMadagascarMalawiMalaysiaMaliMaltaMauritaniaMauritiusMexicoMiddle East & North AfricaMiddle East & North Africa (excluding high income)Middle East & North Africa (IDA & IBRD countries)Middle incomeMoldovaMongoliaMontenegroMoroccoMozambiqueMyanmarNamibiaNepalNetherlandsNew ZealandNicaraguaNigerNigeriaNorth AmericaNorwayOECD membersOmanOther small statesPakistanPanamaPapua New GuineaParaguayPeruPhilippinesPolandPortugalPost-demographic dividendPre-demographic dividendPuerto RicoQatarRomaniaRussian FederationRwandaSamoaSaudi ArabiaSenegalSerbiaSeychellesSierra LeoneSingaporeSlovak RepublicSloveniaSmall statesSomaliaSouth AfricaSouth AsiaSouth Asia (IDA & IBRD)South SudanSpainSri LankaSub-Saharan Africa Sub-Saharan Africa (excluding high income)Sub-Saharan Africa (IDA & IBRD countries)SudanSurinameSwazilandSwedenSwitzerlandSyrian Arab RepublicTajikistanTanzaniaThailandTimor-LesteTogoTrinidad and TobagoTunisiaTurkeyTurkmenistanUgandaUkraineUnited Arab EmiratesUnited KingdomUnited StatesUruguayUzbekistanVanuatuVenezuela, RBVietnamWest Bank and GazaWorldZambiaZimbabwe Linea del tempo:
Questa scala temporale mostra un grafico dal 1962 anno al 2016 anno. Nicaragua. I dati fino ad 1961 anno non disponibili. Il numero di osservazioni attuali secondo i date: 55.
La fonte (nome):
Indicatori dello sviluppo mondiale
La fonte (organizzazione):
World Bank national accounts data, and OECD National Accounts data files.
Categorie:
Economy & Growth, Trade
sono stati aggiornati
23 apr 2017 anni
Indicatori delle variazioni dei valori per anni
Minima:
-40.6
1 gen 1981 anni
Massimo:
31.159
1 gen 1990 anni
Alla data di osservazione
Valore
Variazione assoluta
La variazione rispetto al valore precedente
1 gen 1962 anni
5.985
+5.985
0.0%
1 gen 1963 anni
21.129
+15.145
253.07%
1 gen 1964 anni
23.91
+2.78
13.16%
1 gen 1965 anni
19.296
-4.614
-19.3%
1 gen 1966 anni
8.037
-11.259
-58.35%
1 gen 1967 anni
-1.519
-9.555
-118.9%
1 gen 1968 anni
10.379
+11.897
-783.46%
1 gen 1969 anni
-0.397
-10.776
-103.83%
1 gen 1970 anni
1.595
+1.992
-501.59%
1 gen 1971 anni
5.829
+4.234
265.49%
1 gen 1972 anni
3.732
-2.097
-35.97%
1 gen 1973 anni
31.111
+27.378
733.53%
1 gen 1974 anni
-0.898
-32.009
-102.89%
1 gen 1975 anni
1.413
+2.311
-257.31%
1 gen 1976 anni
7.38
+5.967
422.29%
1 gen 1977 anni
3.986
-3.393
-45.98%
1 gen 1978 anni
-2.817
-6.803
-170.67%
1 gen 1979 anni
9.029
+11.846
-420.49%
1 gen 1980 anni
14.436
+5.407
59.89%
1 gen 1981 anni
-40.6
-55.036
-381.24%
1 gen 1982 anni
14.875
+55.475
-136.64%
1 gen 1983 anni
-8.048
-22.923
-154.1%
1 gen 1984 anni
7.077
+15.125
-187.93%
1 gen 1985 anni
-20.815
-27.892
-394.13%
1 gen 1986 anni
-11.705
+9.11
-43.76%
1 gen 1987 anni
-17.629
-5.923
50.6%
1 gen 1988 anni
-2.2
+15.429
-87.52%
1 gen 1989 anni
-1.068
+1.131
-51.42%
1 gen 1990 anni
31.159
+32.227
-3.02 Mille.%
1 gen 1991 anni
19.311
-11.848
-38.03%
1 gen 1992 anni
-15.199
-34.51
-178.71%
1 gen 1993 anni
20.227
+35.426
-233.08%
1 gen 1994 anni
4.409
-15.818
-78.2%
1 gen 1995 anni
-6.856
-11.264
-255.5%
1 gen 1996 anni
22.073
+28.928
-421.96%
1 gen 1997 anni
16.228
-5.845
-26.48%
1 gen 1998 anni
14.363
-1.865
-11.49%
1 gen 1999 anni
5.882
-8.481
-59.05%
1 gen 2000 anni
12.249
+6.367
108.24%
1 gen 2001 anni
12.515
+0.266
2.17%
1 gen 2002 anni
7.35
-5.165
-41.27%
1 gen 2003 anni
-3.512
-10.861
-147.78%
1 gen 2004 anni
9.177
+12.688
-361.32%
1 gen 2005 anni
17.105
+7.929
86.4%
1 gen 2006 anni
7.669
-9.436
-55.16%
1 gen 2007 anni
12.494
+4.825
62.91%
1 gen 2008 anni
11.062
-1.432
-11.46%
1 gen 2009 anni
9.021
-2.041
-18.45%
1 gen 2010 anni
0.8
-8.221
-91.13%
1 gen 2011 anni
19.891
+19.091
2.39 Mille.%
1 gen 2012 anni
7.738
-12.153
-61.1%
1 gen 2013 anni
12.035
+4.297
55.53%
1 gen 2014 anni
3.341
-8.694
-72.24%
1 gen 2015 anni
6.627
+3.286
98.37%
1 gen 2016 anni
-2.017
-8.644
-130.44%
Classificazione dei paesi secondo i statistiche attuali per anni


Commenti: