29
/it/
it
AIzaSyAYiBZKx7MnpbEhh9jyipgxe19OcubqV5w
April 1, 2024
209663
New Zealand
NZL
true
2
1
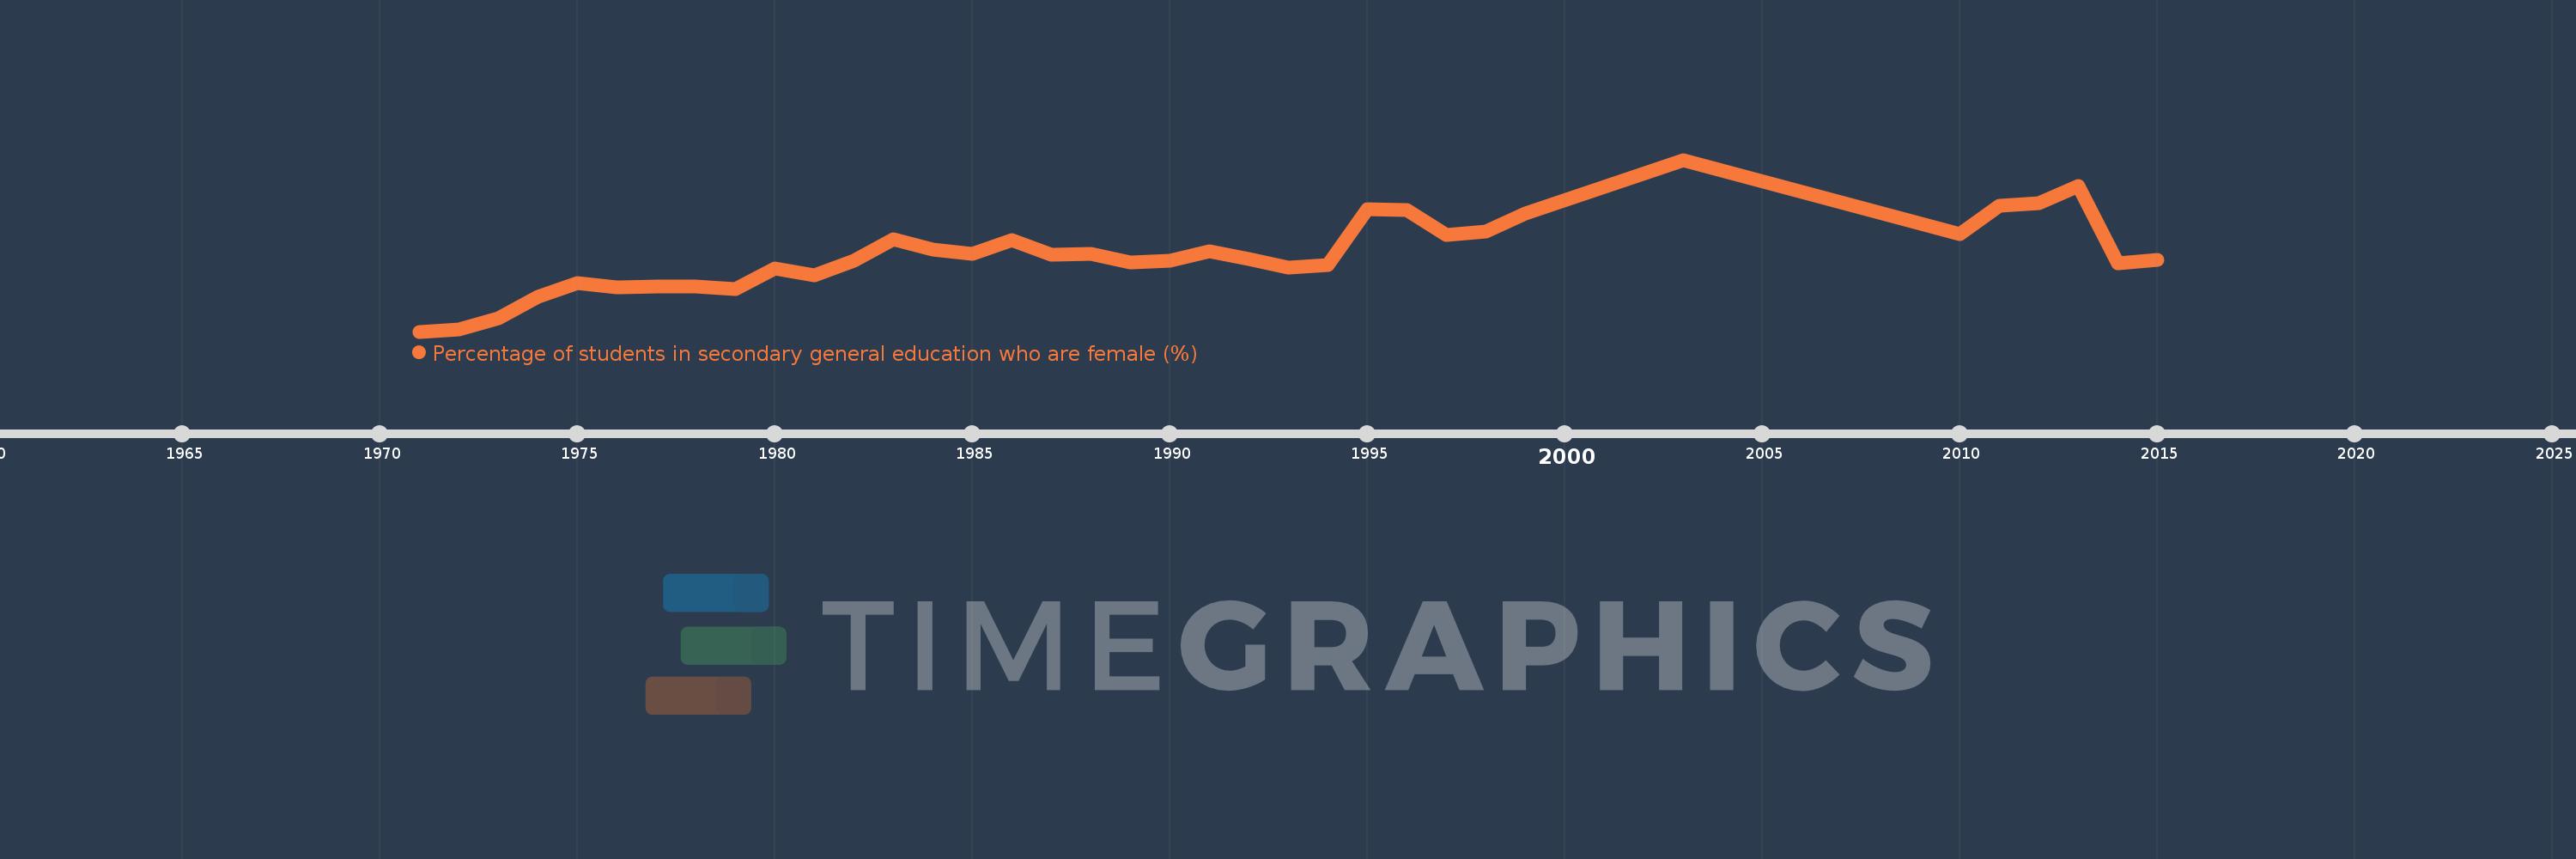
Percentage of students in secondary general education who are female (%)
2015,2014,2013,2012,2011,2010,2003,1999,1998,1997,1996,1995,1994,1993,1992,1991,1990,1989,1988,1987,1986,1985,1984,1983,1982,1981,1980,1979,1978,1977,1976,1975,1974,1973,1972,1971
Queste statistiche in altri paesi:
AfghanistanAlbaniaAlgeriaAndorraAngolaAntigua and BarbudaArab WorldArgentinaArmeniaArubaAustraliaAustriaAzerbaijanBahamas, TheBahrainBangladeshBarbadosBelarusBelgiumBelizeBeninBermudaBhutanBoliviaBosnia and HerzegovinaBotswanaBrazilBritish Virgin IslandsBrunei DarussalamBulgariaBurkina FasoBurundiCabo VerdeCambodiaCameroonCanadaCaribbean small statesCayman IslandsCentral African RepublicCentral Europe and the BalticsChadChileChinaColombiaComorosCongo, Dem. Rep.Congo, Rep.Costa RicaCote d'IvoireCroatiaCubaCuracaoCyprusCzech RepublicDenmarkDjiboutiDominicaDominican RepublicEarly-demographic dividendEast Asia & PacificEast Asia & Pacific (excluding high income)East Asia & Pacific (IDA & IBRD countries)EcuadorEgypt, Arab Rep.El SalvadorEquatorial GuineaEritreaEstoniaEthiopiaEuro areaEurope & Central AsiaEurope & Central Asia (excluding high income)Europe & Central Asia (IDA & IBRD countries)European UnionFijiFinlandFragile and conflict affected situationsFranceGabonGambia, TheGeorgiaGermanyGhanaGibraltarGreeceGrenadaGuatemalaGuineaGuinea-BissauGuyanaHaitiHeavily indebted poor countries (HIPC)High incomeHondurasHong Kong SAR, ChinaHungaryIBRD onlyIcelandIDA & IBRD totalIDA blendIDA onlyIDA totalIndiaIndonesiaIran, Islamic Rep.IraqIrelandIsraelItalyJamaicaJapanJordanKazakhstanKenyaKiribatiKorea, Dem. People’s Rep.Korea, Rep.KuwaitKyrgyz RepublicLao PDRLate-demographic dividendLatin America & Caribbean Latin America & Caribbean (excluding high income)Latin America & the Caribbean (IDA & IBRD countries)LatviaLeast developed countries: UN classificationLebanonLesothoLiberiaLibyaLiechtensteinLithuaniaLow & middle incomeLow incomeLower middle incomeLuxembourgMacao SAR, ChinaMacedonia, FYRMadagascarMalawiMalaysiaMaldivesMaliMaltaMarshall IslandsMauritaniaMauritiusMexicoMicronesia, Fed. Sts.Middle East & North AfricaMiddle East & North Africa (excluding high income)Middle East & North Africa (IDA & IBRD countries)Middle incomeMoldovaMonacoMongoliaMontenegroMoroccoMozambiqueMyanmarNamibiaNauruNepalNetherlandsNew ZealandNicaraguaNigerNigeriaNorth AmericaNorwayOECD membersOmanOther small statesPacific island small statesPakistanPalauPanamaPapua New GuineaParaguayPeruPhilippinesPolandPortugalPost-demographic dividendPre-demographic dividendPuerto RicoQatarRomaniaRussian FederationRwandaSamoaSan MarinoSao Tome and PrincipeSaudi ArabiaSenegalSerbiaSeychellesSierra LeoneSingaporeSint Maarten (Dutch part)Slovak RepublicSloveniaSmall statesSolomon IslandsSomaliaSouth AfricaSouth AsiaSouth Asia (IDA & IBRD)South SudanSpainSri LankaSt. Kitts and NevisSt. LuciaSt. Vincent and the GrenadinesSub-Saharan Africa Sub-Saharan Africa (excluding high income)Sub-Saharan Africa (IDA & IBRD countries)SudanSurinameSwazilandSwedenSwitzerlandSyrian Arab RepublicTajikistanTanzaniaThailandTimor-LesteTogoTongaTrinidad and TobagoTunisiaTurkeyTurkmenistanTurks and Caicos IslandsTuvaluUgandaUkraineUnited Arab EmiratesUnited KingdomUnited StatesUpper middle incomeUruguayUzbekistanVanuatuVenezuela, RBVietnamWest Bank and GazaWorldYemen, Rep.ZambiaZimbabwe Linea del tempo:
Questa scala temporale mostra un grafico dal 1971 anno al 2015 anno. New Zealand. I dati fino ad 1970 anno non disponibili. Il numero di osservazioni attuali secondo i date: 36.
La fonte (nome):
Indicatori dello sviluppo mondiale
La fonte (organizzazione):
UNESCO Institute for Statistics
Categorie:
Education, Gender
sono stati aggiornati
23 apr 2017 anni
Indicatori delle variazioni dei valori per anni
Minima:
48.459
1 gen 1971 anni
Massimo:
50.539
1 gen 2003 anni
Alla data di osservazione
Valore
Variazione assoluta
La variazione rispetto al valore precedente
1 gen 1971 anni
48.459
+48.459
0.0%
1 gen 1972 anni
48.481
+0.022
0.05%
1 gen 1973 anni
48.619
+0.138
0.28%
1 gen 1974 anni
48.877
+0.258
0.53%
1 gen 1975 anni
49.049
+0.173
0.35%
1 gen 1976 anni
48.992
-0.058
-0.12%
1 gen 1977 anni
49.005
+0.014
0.03%
1 gen 1978 anni
49.003
-0.002
0.0%
1 gen 1979 anni
48.971
-0.032
-0.07%
1 gen 1980 anni
49.221
+0.25
0.51%
1 gen 1981 anni
49.138
-0.083
-0.17%
1 gen 1982 anni
49.316
+0.178
0.36%
1 gen 1983 anni
49.575
+0.259
0.52%
1 gen 1984 anni
49.448
-0.127
-0.26%
1 gen 1985 anni
49.4
-0.049
-0.1%
1 gen 1986 anni
49.571
+0.171
0.35%
1 gen 1987 anni
49.393
-0.178
-0.36%
1 gen 1988 anni
49.401
+0.008
0.02%
1 gen 1989 anni
49.298
-0.103
-0.21%
1 gen 1990 anni
49.312
+0.014
0.03%
1 gen 1991 anni
49.433
+0.12
0.24%
1 gen 1992 anni
49.335
-0.097
-0.2%
1 gen 1993 anni
49.234
-0.101
-0.21%
1 gen 1994 anni
49.264
+0.03
0.06%
1 gen 1995 anni
49.939
+0.675
1.37%
1 gen 1996 anni
49.932
-0.007
-0.01%
1 gen 1997 anni
49.63
-0.302
-0.6%
1 gen 1998 anni
49.667
+0.036
0.07%
1 gen 1999 anni
49.893
+0.226
0.46%
1 gen 2003 anni
50.539
+0.646
1.29%
1 gen 2010 anni
49.64
-0.899
-1.78%
1 gen 2011 anni
49.979
+0.34
0.68%
1 gen 2012 anni
50.015
+0.036
0.07%
1 gen 2013 anni
50.224
+0.209
0.42%
1 gen 2014 anni
49.285
-0.939
-1.87%
1 gen 2015 anni
49.33
+0.045
0.09%
Classificazione dei paesi secondo i statistiche attuali per anni


Commenti: