29
/it/
it
AIzaSyAYiBZKx7MnpbEhh9jyipgxe19OcubqV5w
April 1, 2024
207418
Nepal
NPL
true
2
1
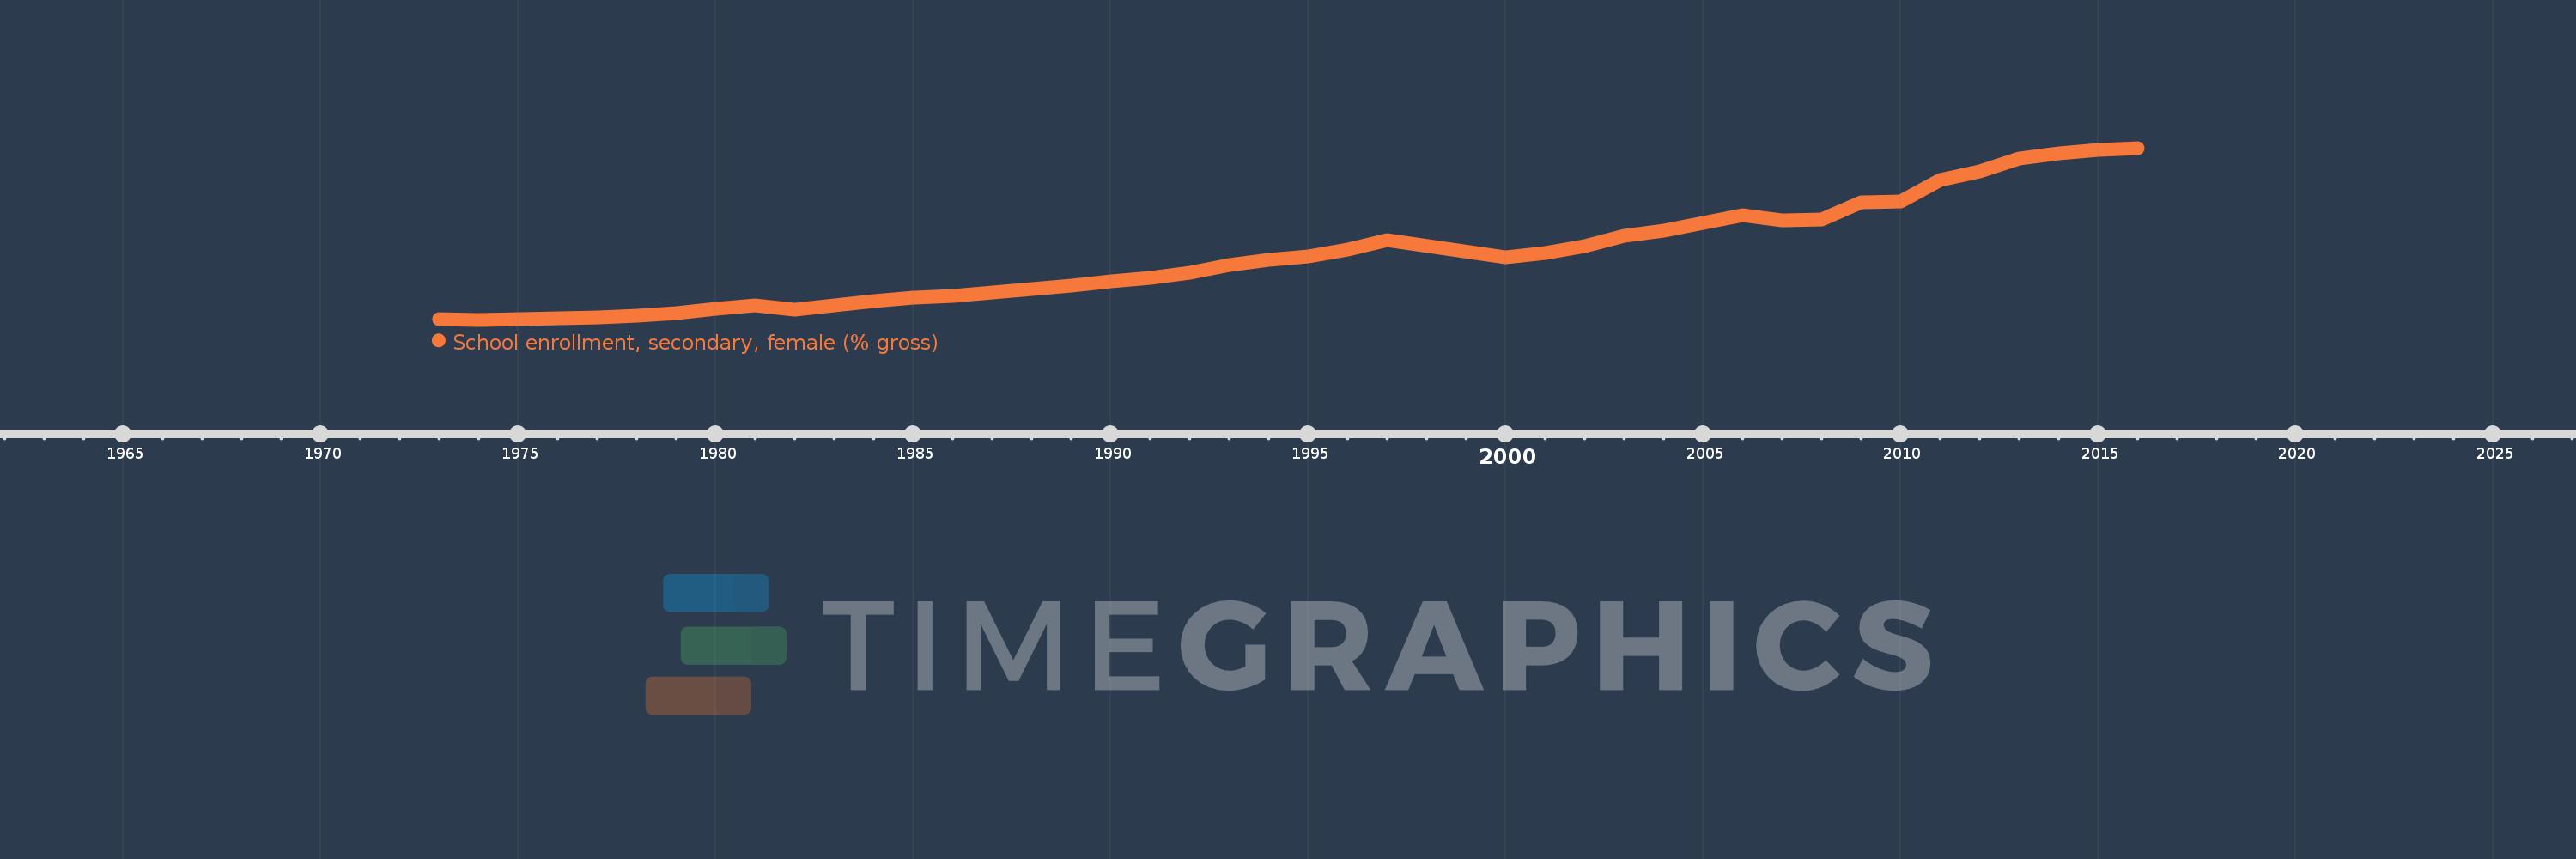
School enrollment, secondary, female (% gross)
2016,2015,2014,2013,2012,2011,2010,2009,2008,2007,2006,2004,2003,2002,2001,2000,1997,1996,1995,1994,1993,1992,1991,1990,1989,1988,1987,1986,1985,1984,1983,1982,1981,1980,1979,1978,1977,1976,1975,1974,1973
Queste statistiche in altri paesi:
AfghanistanAlbaniaAlgeriaAndorraAngolaAntigua and BarbudaArab WorldArgentinaArmeniaArubaAustraliaAustriaAzerbaijanBahamas, TheBahrainBangladeshBarbadosBelarusBelgiumBelizeBeninBermudaBhutanBoliviaBosnia and HerzegovinaBotswanaBrazilBrunei DarussalamBulgariaBurkina FasoBurundiCabo VerdeCambodiaCameroonCanadaCaribbean small statesCentral African RepublicCentral Europe and the BalticsChadChileChinaColombiaComorosCongo, Dem. Rep.Congo, Rep.Costa RicaCote d'IvoireCroatiaCubaCuracaoCyprusCzech RepublicDenmarkDjiboutiDominicaDominican RepublicEarly-demographic dividendEast Asia & PacificEast Asia & Pacific (excluding high income)East Asia & Pacific (IDA & IBRD countries)EcuadorEgypt, Arab Rep.El SalvadorEquatorial GuineaEritreaEstoniaEthiopiaEuro areaEurope & Central AsiaEurope & Central Asia (excluding high income)Europe & Central Asia (IDA & IBRD countries)European UnionFijiFinlandFragile and conflict affected situationsFranceGabonGambia, TheGeorgiaGermanyGhanaGreeceGrenadaGuatemalaGuineaGuinea-BissauGuyanaHeavily indebted poor countries (HIPC)High incomeHondurasHong Kong SAR, ChinaHungaryIBRD onlyIcelandIDA & IBRD totalIDA blendIDA onlyIDA totalIndiaIndonesiaIran, Islamic Rep.IraqIrelandIsraelItalyJamaicaJapanJordanKazakhstanKenyaKiribatiKorea, Dem. People’s Rep.Korea, Rep.KuwaitKyrgyz RepublicLao PDRLate-demographic dividendLatin America & Caribbean Latin America & Caribbean (excluding high income)Latin America & the Caribbean (IDA & IBRD countries)LatviaLeast developed countries: UN classificationLebanonLesothoLiberiaLibyaLiechtensteinLithuaniaLow & middle incomeLow incomeLower middle incomeLuxembourgMacao SAR, ChinaMacedonia, FYRMadagascarMalawiMaldivesMaliMaltaMarshall IslandsMauritaniaMauritiusMexicoMicronesia, Fed. Sts.Middle East & North AfricaMiddle East & North Africa (excluding high income)Middle East & North Africa (IDA & IBRD countries)Middle incomeMoldovaMongoliaMontenegroMoroccoMozambiqueMyanmarNamibiaNauruNepalNetherlandsNew ZealandNicaraguaNigerNigeriaNorth AmericaNorwayOECD membersOmanOther small statesPacific island small statesPakistanPalauPanamaPapua New GuineaParaguayPeruPhilippinesPolandPortugalPost-demographic dividendPre-demographic dividendPuerto RicoQatarRomaniaRussian FederationRwandaSamoaSan MarinoSao Tome and PrincipeSaudi ArabiaSenegalSerbiaSeychellesSierra LeoneSlovak RepublicSloveniaSmall statesSolomon IslandsSomaliaSouth AfricaSouth AsiaSouth Asia (IDA & IBRD)SpainSri LankaSt. Kitts and NevisSt. LuciaSt. Vincent and the GrenadinesSub-Saharan Africa Sub-Saharan Africa (excluding high income)Sub-Saharan Africa (IDA & IBRD countries)SudanSurinameSwazilandSwedenSwitzerlandSyrian Arab RepublicTajikistanTanzaniaThailandTimor-LesteTogoTongaTrinidad and TobagoTunisiaTurkeyTurkmenistanTuvaluUgandaUkraineUnited Arab EmiratesUnited KingdomUnited StatesUpper middle incomeUruguayUzbekistanVanuatuVenezuela, RBVietnamWest Bank and GazaWorldYemen, Rep.ZambiaZimbabwe Linea del tempo:
Questa scala temporale mostra un grafico dal 1973 anno al 2016 anno. Nepal. I dati fino ad 1972 anno non disponibili. Il numero di osservazioni attuali secondo i date: 41.
La fonte (nome):
Indicatori dello sviluppo mondiale
La fonte (organizzazione):
United Nations Educational, Scientific, and Cultural Organization (UNESCO) Institute for Statistics.
Categorie:
Education, Gender
sono stati aggiornati
23 apr 2017 anni
Indicatori delle variazioni dei valori per anni
Minima:
3.508
1 gen 1974 anni
Massimo:
69.591
1 gen 2016 anni
Alla data di osservazione
Valore
Variazione assoluta
La variazione rispetto al valore precedente
1 gen 1973 anni
3.776
+3.776
0.0%
1 gen 1974 anni
3.508
-0.268
-7.11%
1 gen 1975 anni
3.638
+0.13
3.72%
1 gen 1976 anni
3.927
+0.289
7.93%
1 gen 1977 anni
4.371
+0.444
11.32%
1 gen 1978 anni
5.172
+0.801
18.33%
1 gen 1979 anni
6.049
+0.877
16.95%
1 gen 1980 anni
7.708
+1.659
27.43%
1 gen 1981 anni
8.92
+1.212
15.72%
1 gen 1982 anni
7.533
-1.387
-15.55%
1 gen 1983 anni
9.085
+1.552
20.6%
1 gen 1984 anni
10.624
+1.539
16.94%
1 gen 1985 anni
11.886
+1.262
11.88%
1 gen 1986 anni
12.523
+0.637
5.36%
1 gen 1987 anni
14.076
+1.553
12.4%
1 gen 1988 anni
15.325
+1.249
8.88%
1 gen 1989 anni
16.726
+1.401
9.14%
1 gen 1990 anni
18.226
+1.5
8.97%
1 gen 1991 anni
19.68
+1.454
7.98%
1 gen 1992 anni
21.647
+1.967
10.0%
1 gen 1993 anni
24.616
+2.969
13.72%
1 gen 1994 anni
26.42
+1.803
7.33%
1 gen 1995 anni
27.822
+1.403
5.31%
1 gen 1996 anni
30.392
+2.57
9.24%
1 gen 1997 anni
33.987
+3.595
11.83%
1 gen 2000 anni
27.579
-6.408
-18.85%
1 gen 2001 anni
29.017
+1.438
5.21%
1 gen 2002 anni
31.741
+2.724
9.39%
1 gen 2003 anni
35.898
+4.156
13.09%
1 gen 2004 anni
37.808
+1.911
5.32%
1 gen 2006 anni
43.594
+5.785
15.3%
1 gen 2007 anni
41.791
-1.803
-4.14%
1 gen 2008 anni
42.125
+0.335
0.8%
1 gen 2009 anni
48.511
+6.386
15.16%
1 gen 2010 anni
48.958
+0.447
0.92%
1 gen 2011 anni
57.28
+8.322
17.0%
1 gen 2012 anni
60.666
+3.386
5.91%
1 gen 2013 anni
65.539
+4.873
8.03%
1 gen 2014 anni
67.443
+1.904
2.91%
1 gen 2015 anni
68.899
+1.456
2.16%
1 gen 2016 anni
69.591
+0.692
1.0%
Classificazione dei paesi secondo i statistiche attuali per anni


Commenti: