29
/it/
it
AIzaSyAYiBZKx7MnpbEhh9jyipgxe19OcubqV5w
April 1, 2024
207337
Nepal
NPL
true
2
1
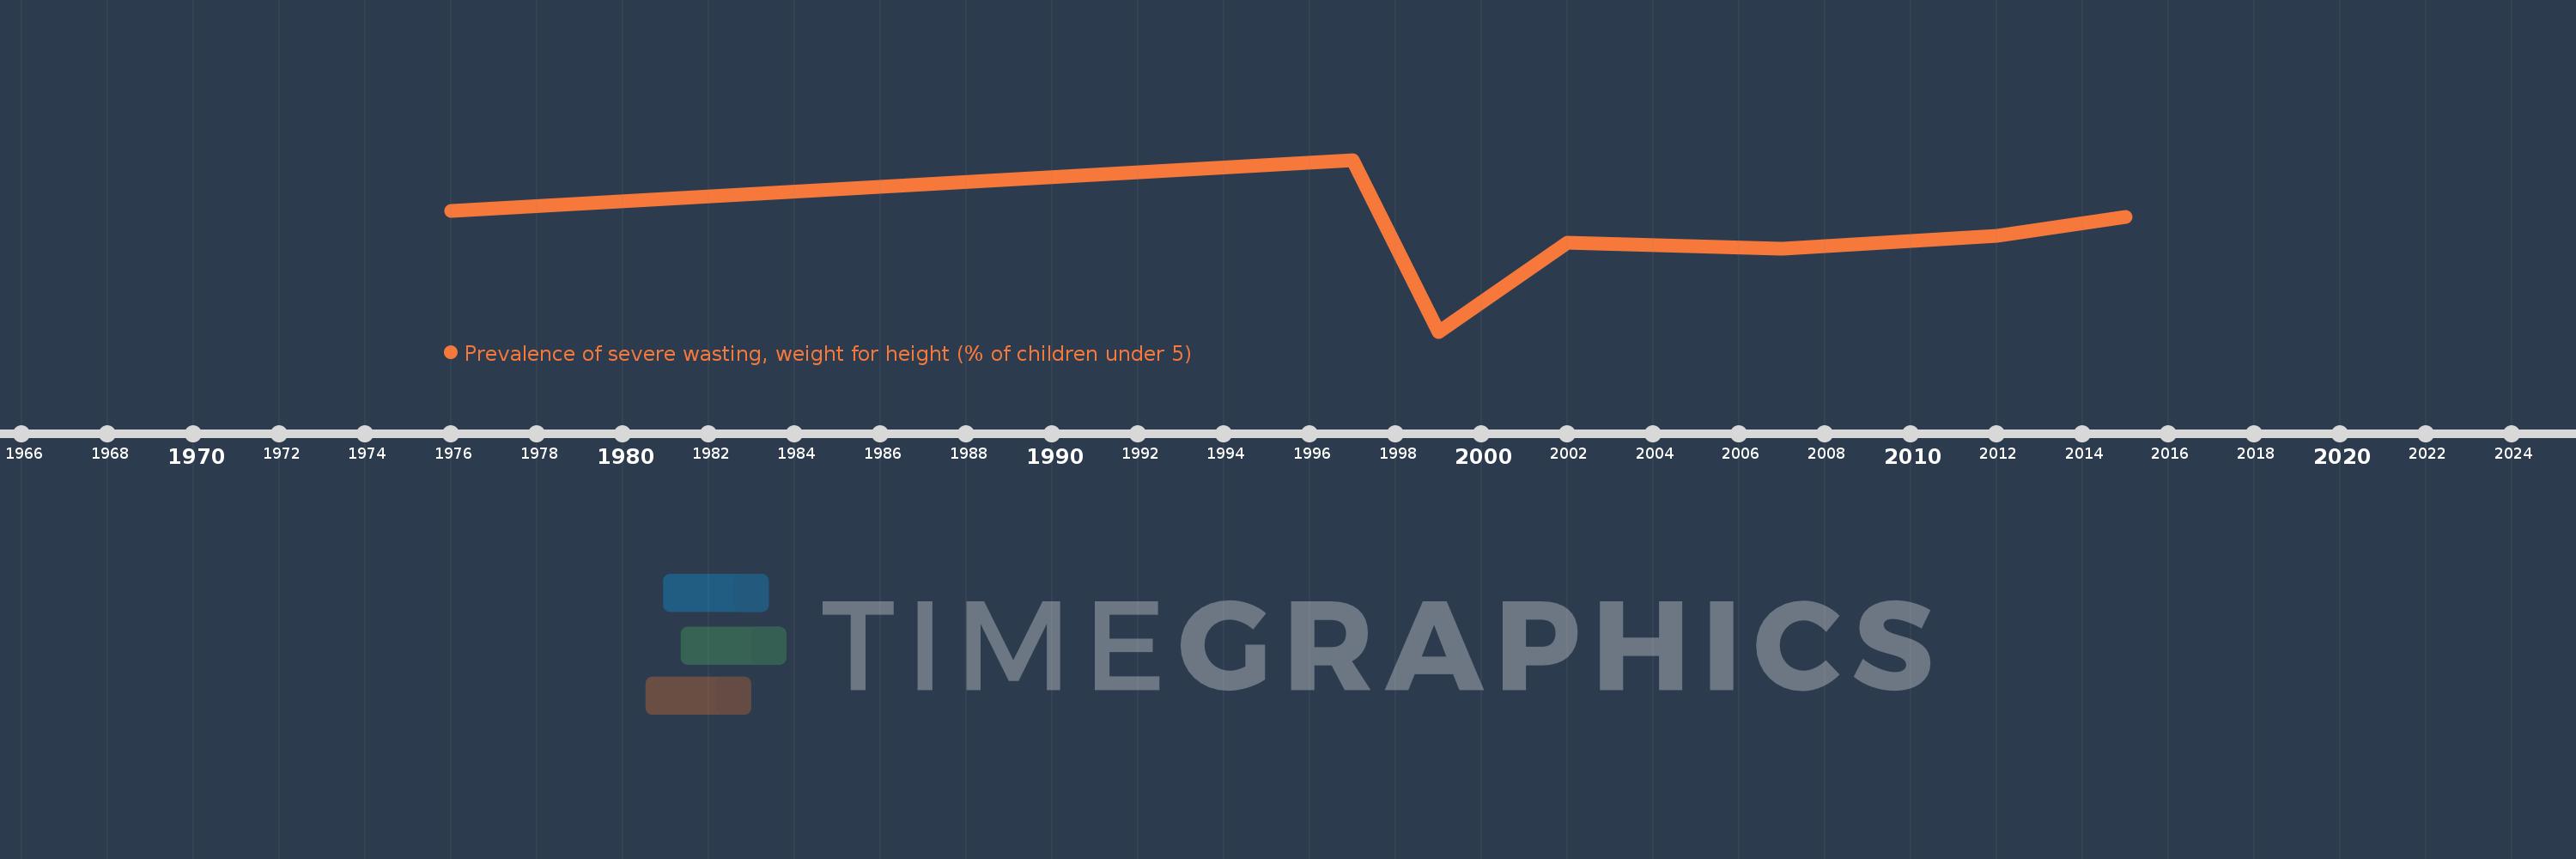
Prevalence of severe wasting, weight for height (% of children under 5)
2015,2012,2007,2002,1999,1997,1976
Queste statistiche in altri paesi:
Linea del tempo:
Questa scala temporale mostra un grafico dal 1976 anno al 2015 anno. Nepal. I dati fino ad 1975 anno non disponibili. Il numero di osservazioni attuali secondo i date: 7.
La fonte (nome):
Indicatori dello sviluppo mondiale
La fonte (organizzazione):
World Health Organization, Global Database on Child Growth and Malnutrition. Country-level data are unadjusted data from national surveys, and thus may not be comparable across countries. Adjusted, comparable data are available at http://www.who.int/nutgrowthdb/en. Aggregation is based on UNICEF, WHO, and the World Bank harmonized dataset (adjusted, comparable data) and methodology.
Categorie:
Health
sono stati aggiornati
23 apr 2017 anni
Indicatori delle variazioni dei valori per anni
Minima:
1.4
1 gen 1999 anni
Massimo:
4.1
1 gen 1997 anni
Alla data di osservazione
Valore
Variazione assoluta
La variazione rispetto al valore precedente
1 gen 1976 anni
3.3
+3.3
0.0%
1 gen 1997 anni
4.1
+0.8
24.24%
1 gen 1999 anni
1.4
-2.7
-65.85%
1 gen 2002 anni
2.8
+1.4
100.0%
1 gen 2007 anni
2.7
-0.1
-3.57%
1 gen 2012 anni
2.9
+0.2
7.41%
1 gen 2015 anni
3.2
+0.3
10.34%
Classificazione dei paesi secondo i statistiche attuali per anni


Commenti: