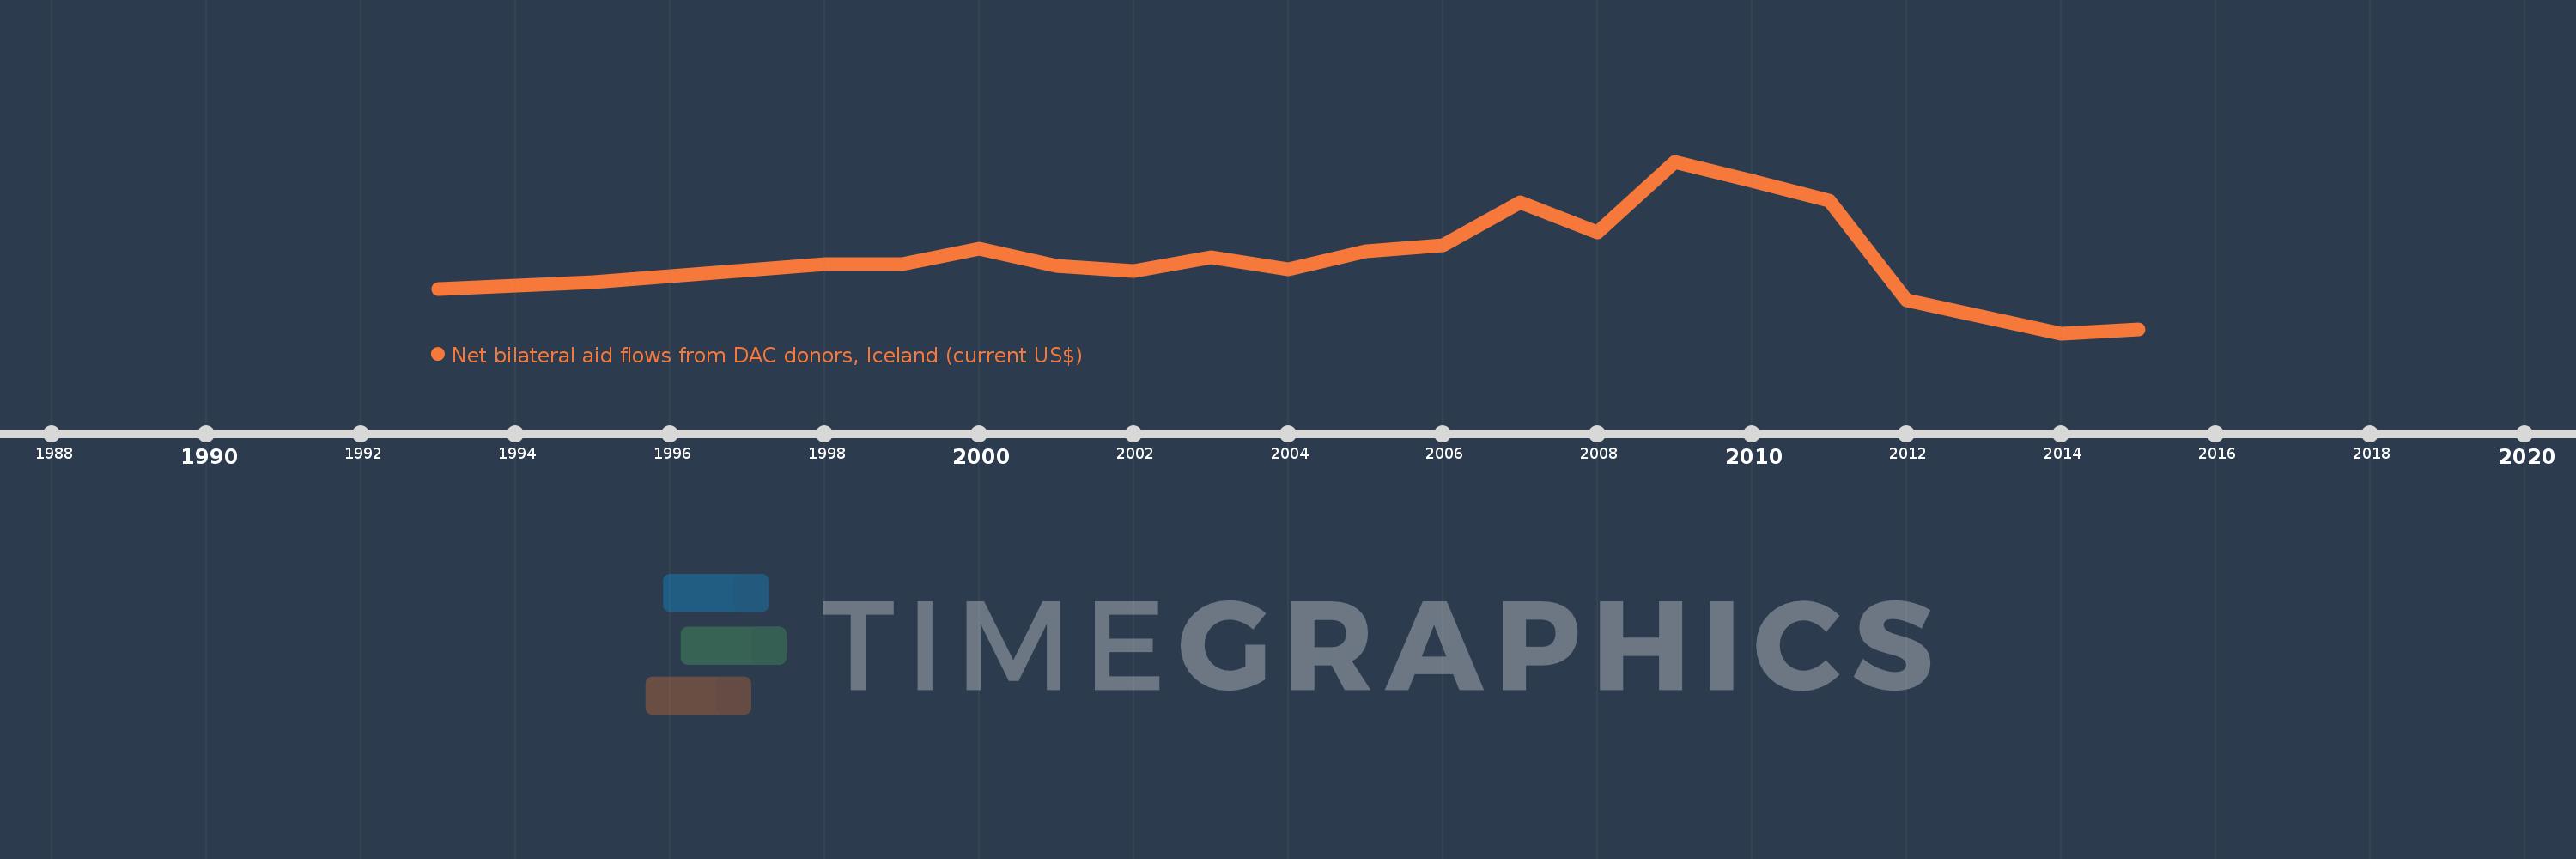
Questa scala temporale mostra un grafico dal 1993 anno al 2015 anno. Namibia. I dati fino ad 1992 anno non disponibili. Il numero di osservazioni attuali secondo i date: 19.
La fonte (nome):
Indicatori dello sviluppo mondiale
La fonte (organizzazione):
Development Assistance Committee of the Organisation for Economic Co-operation and Development, Geographical Distribution of Financial Flows to Developing Countries, Development Co-operation Report, and International Development Statistics database. Data are available online at: www.oecd.org/dac/stats/idsonline.
Categorie:
Aid Effectiveness
sono stati aggiornati
23 apr 2017 anni
Indicatori delle variazioni dei valori per anni
In media:
1.212 Mln
Minima:
20.0 Mille.
1 gen 2014 anni
Massimo:
2.64 Mln
1 gen 2009 anni
Alla data di osservazione
Valore
Variazione assoluta
La variazione rispetto al valore precedente
1 gen 1993 anni
700.0 Mille.
+700.0 Mille.
0.0%
1 gen 1995 anni
800.0 Mille.
+100.0 Mille.
14.29%
1 gen 1998 anni
1.08 Mln
+280.0 Mille.
35.0%
1 gen 1999 anni
1.08 Mln
0.0
0.0%
1 gen 2000 anni
1.31 Mln
+230.0 Mille.
21.3%
1 gen 2001 anni
1.05 Mln
-260.0 Mille.
-19.85%
1 gen 2002 anni
970.0 Mille.
-80.0 Mille.
-7.62%
1 gen 2003 anni
1.18 Mln
+210.0 Mille.
21.65%
1 gen 2004 anni
1000.0 Mille.
-180.0 Mille.
-15.25%
1 gen 2005 anni
1.27 Mln
+270.0 Mille.
27.0%
1 gen 2006 anni
1.36 Mln
+90.0 Mille.
7.09%
1 gen 2007 anni
2.02 Mln
+660.0 Mille.
48.53%
1 gen 2008 anni
1.56 Mln
-460.0 Mille.
-22.77%
1 gen 2009 anni
2.64 Mln
+1.08 Mln
69.23%
1 gen 2010 anni
2.35 Mln
-290.0 Mille.
-10.98%
1 gen 2011 anni
2.04 Mln
-310.0 Mille.
-13.19%
1 gen 2012 anni
520.0 Mille.
-1.52 Mln
-74.51%
1 gen 2014 anni
20.0 Mille.
-500.0 Mille.
-96.15%
1 gen 2015 anni
80.0 Mille.
+60.0 Mille.
300.0%
Classificazione dei paesi secondo i statistiche attuali per anni
