29
/it/
it
AIzaSyAYiBZKx7MnpbEhh9jyipgxe19OcubqV5w
April 1, 2024
203918
Myanmar
MMR
true
2
1
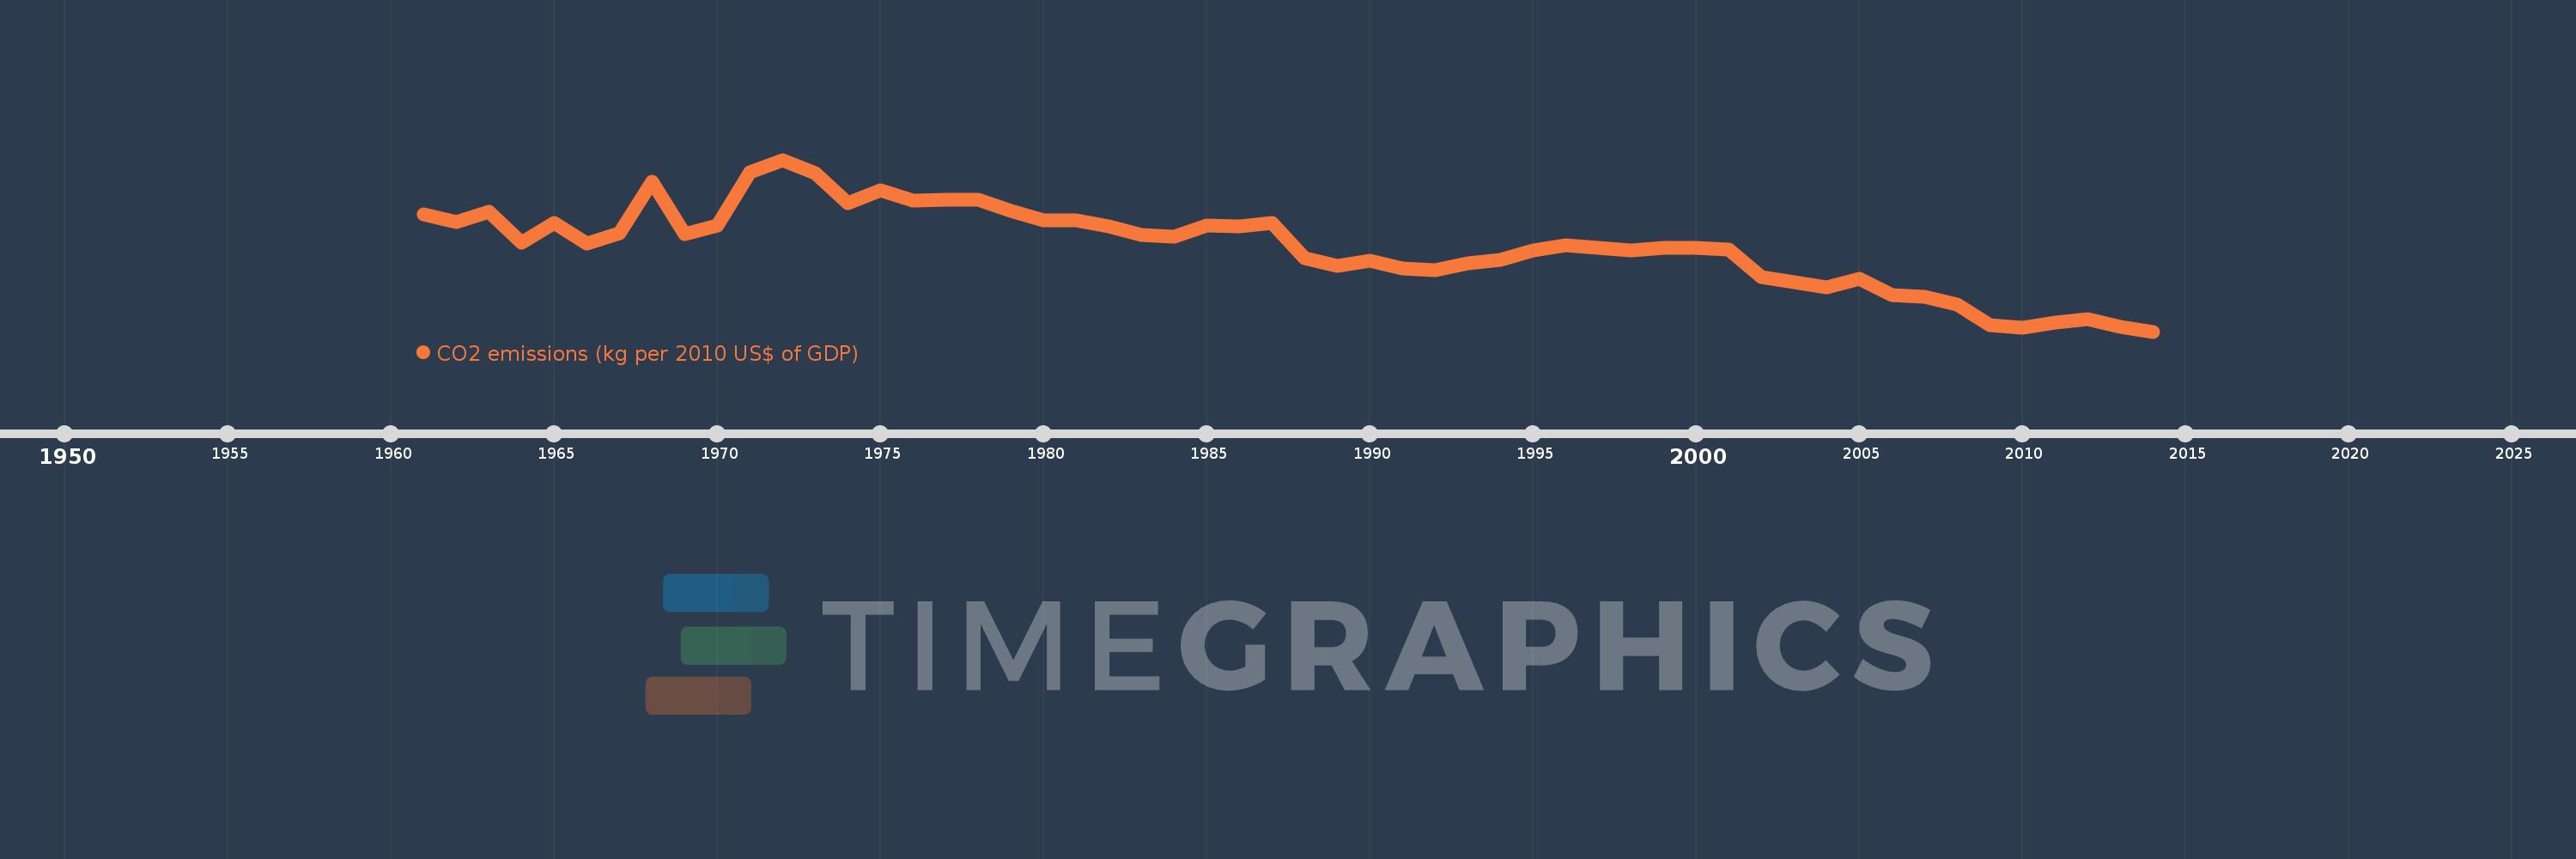
CO2 emissions (kg per 2010 US$ of GDP)
2014,2013,2012,2011,2010,2009,2008,2007,2006,2005,2004,2003,2002,2001,2000,1999,1998,1997,1996,1995,1994,1993,1992,1991,1990,1989,1988,1987,1986,1985,1984,1983,1982,1981,1980,1979,1978,1977,1976,1975,1974,1973,1972,1971,1970,1969,1968,1967,1966,1965,1964,1963,1962,1961
Queste statistiche in altri paesi:
AfghanistanAlbaniaAlgeriaAndorraAngolaAntigua and BarbudaArab WorldArgentinaArmeniaArubaAustraliaAustriaAzerbaijanBahamas, TheBahrainBangladeshBarbadosBelarusBelgiumBelizeBeninBermudaBhutanBoliviaBosnia and HerzegovinaBotswanaBrazilBrunei DarussalamBulgariaBurkina FasoBurundiCabo VerdeCambodiaCameroonCanadaCaribbean small statesCentral African RepublicCentral Europe and the BalticsChadChileChinaColombiaComorosCongo, Dem. Rep.Congo, Rep.Costa RicaCote d'IvoireCroatiaCubaCyprusCzech RepublicDenmarkDjiboutiDominicaDominican RepublicEarly-demographic dividendEast Asia & PacificEast Asia & Pacific (excluding high income)East Asia & Pacific (IDA & IBRD countries)EcuadorEgypt, Arab Rep.El SalvadorEquatorial GuineaEritreaEstoniaEthiopiaEuro areaEurope & Central AsiaEurope & Central Asia (excluding high income)Europe & Central Asia (IDA & IBRD countries)European UnionFaroe IslandsFijiFinlandFragile and conflict affected situationsFranceGabonGambia, TheGeorgiaGermanyGhanaGreeceGreenlandGrenadaGuatemalaGuineaGuinea-BissauGuyanaHaitiHeavily indebted poor countries (HIPC)High incomeHondurasHong Kong SAR, ChinaHungaryIBRD onlyIcelandIDA & IBRD totalIDA blendIDA onlyIDA totalIndiaIndonesiaIran, Islamic Rep.IraqIrelandIsraelItalyJamaicaJapanJordanKazakhstanKenyaKiribatiKorea, Rep.KuwaitKyrgyz RepublicLao PDRLate-demographic dividendLatin America & Caribbean Latin America & Caribbean (excluding high income)Latin America & the Caribbean (IDA & IBRD countries)LatviaLeast developed countries: UN classificationLebanonLesothoLiberiaLibyaLiechtensteinLithuaniaLow & middle incomeLow incomeLower middle incomeLuxembourgMacao SAR, ChinaMacedonia, FYRMadagascarMalawiMalaysiaMaldivesMaliMaltaMarshall IslandsMauritaniaMauritiusMexicoMicronesia, Fed. Sts.Middle East & North AfricaMiddle East & North Africa (excluding high income)Middle East & North Africa (IDA & IBRD countries)Middle incomeMoldovaMongoliaMontenegroMoroccoMozambiqueMyanmarNamibiaNauruNepalNetherlandsNew ZealandNicaraguaNigerNigeriaNorth AmericaNorwayOECD membersOmanOther small statesPacific island small statesPakistanPalauPanamaPapua New GuineaParaguayPeruPhilippinesPolandPortugalPost-demographic dividendPre-demographic dividendQatarRomaniaRussian FederationRwandaSamoaSao Tome and PrincipeSaudi ArabiaSenegalSerbiaSeychellesSierra LeoneSingaporeSlovak RepublicSloveniaSmall statesSolomon IslandsSouth AfricaSouth AsiaSouth Asia (IDA & IBRD)South SudanSpainSri LankaSt. Kitts and NevisSt. LuciaSt. Vincent and the GrenadinesSub-Saharan Africa Sub-Saharan Africa (excluding high income)Sub-Saharan Africa (IDA & IBRD countries)SudanSurinameSwazilandSwedenSwitzerlandTajikistanTanzaniaThailandTimor-LesteTogoTongaTrinidad and TobagoTunisiaTurkeyTurkmenistanUgandaUkraineUnited Arab EmiratesUnited KingdomUnited StatesUpper middle incomeUruguayUzbekistanVanuatuVenezuela, RBVietnamWest Bank and GazaWorldYemen, Rep.ZambiaZimbabwe Linea del tempo:
Questa scala temporale mostra un grafico dal 1961 anno al 2014 anno. Myanmar. I dati fino ad 1960 anno non disponibili. Il numero di osservazioni attuali secondo i date: 54.
La fonte (nome):
Indicatori dello sviluppo mondiale
La fonte (organizzazione):
Carbon Dioxide Information Analysis Center, Environmental Sciences Division, Oak Ridge National Laboratory, Tennessee, United States.
Categorie:
Climate Change, Environment
sono stati aggiornati
23 apr 2017 anni
Indicatori delle variazioni dei valori per anni
Minima:
0.207
1 gen 2014 anni
Massimo:
1.095
1 gen 1972 anni
Alla data di osservazione
Valore
Variazione assoluta
La variazione rispetto al valore precedente
1 gen 1961 anni
0.815
+0.815
0.0%
1 gen 1962 anni
0.774
-0.041
-5.04%
1 gen 1963 anni
0.827
+0.053
6.81%
1 gen 1964 anni
0.667
-0.16
-19.3%
1 gen 1965 anni
0.769
+0.102
15.28%
1 gen 1966 anni
0.663
-0.106
-13.83%
1 gen 1967 anni
0.717
+0.054
8.21%
1 gen 1968 anni
0.982
+0.265
36.97%
1 gen 1969 anni
0.71
-0.273
-27.76%
1 gen 1970 anni
0.754
+0.044
6.26%
1 gen 1971 anni
1.031
+0.277
36.75%
1 gen 1972 anni
1.095
+0.064
6.18%
1 gen 1973 anni
1.026
-0.069
-6.31%
1 gen 1974 anni
0.869
-0.157
-15.27%
1 gen 1975 anni
0.939
+0.069
7.97%
1 gen 1976 anni
0.884
-0.054
-5.79%
1 gen 1977 anni
0.89
+0.006
0.67%
1 gen 1978 anni
0.887
-0.003
-0.32%
1 gen 1979 anni
0.83
-0.057
-6.45%
1 gen 1980 anni
0.781
-0.049
-5.96%
1 gen 1981 anni
0.783
+0.003
0.37%
1 gen 1982 anni
0.752
-0.032
-4.04%
1 gen 1983 anni
0.707
-0.045
-5.98%
1 gen 1984 anni
0.698
-0.008
-1.2%
1 gen 1985 anni
0.757
+0.059
8.43%
1 gen 1986 anni
0.752
-0.005
-0.71%
1 gen 1987 anni
0.769
+0.017
2.28%
1 gen 1988 anni
0.587
-0.182
-23.67%
1 gen 1989 anni
0.548
-0.039
-6.65%
1 gen 1990 anni
0.573
+0.025
4.51%
1 gen 1991 anni
0.534
-0.039
-6.82%
1 gen 1992 anni
0.525
-0.008
-1.59%
1 gen 1993 anni
0.56
+0.035
6.63%
1 gen 1994 anni
0.577
+0.017
3.08%
1 gen 1995 anni
0.628
+0.051
8.75%
1 gen 1996 anni
0.654
+0.026
4.21%
1 gen 1997 anni
0.641
-0.013
-2.04%
1 gen 1998 anni
0.627
-0.014
-2.19%
1 gen 1999 anni
0.638
+0.011
1.76%
1 gen 2000 anni
0.638
+0.0
0.08%
1 gen 2001 anni
0.631
-0.007
-1.12%
1 gen 2002 anni
0.49
-0.141
-22.33%
1 gen 2003 anni
0.462
-0.028
-5.78%
1 gen 2004 anni
0.434
-0.028
-6.07%
1 gen 2005 anni
0.482
+0.049
11.21%
1 gen 2006 anni
0.396
-0.086
-17.87%
1 gen 2007 anni
0.388
-0.008
-2.03%
1 gen 2008 anni
0.347
-0.041
-10.53%
1 gen 2009 anni
0.24
-0.107
-30.95%
1 gen 2010 anni
0.226
-0.013
-5.58%
1 gen 2011 anni
0.253
+0.026
11.58%
1 gen 2012 anni
0.273
+0.021
8.19%
1 gen 2013 anni
0.23
-0.043
-15.72%
1 gen 2014 anni
0.207
-0.023
-10.12%
Classificazione dei paesi secondo i statistiche attuali per anni


Commenti: