29
/it/
it
AIzaSyAYiBZKx7MnpbEhh9jyipgxe19OcubqV5w
April 1, 2024
203905
Myanmar
MMR
true
2
1
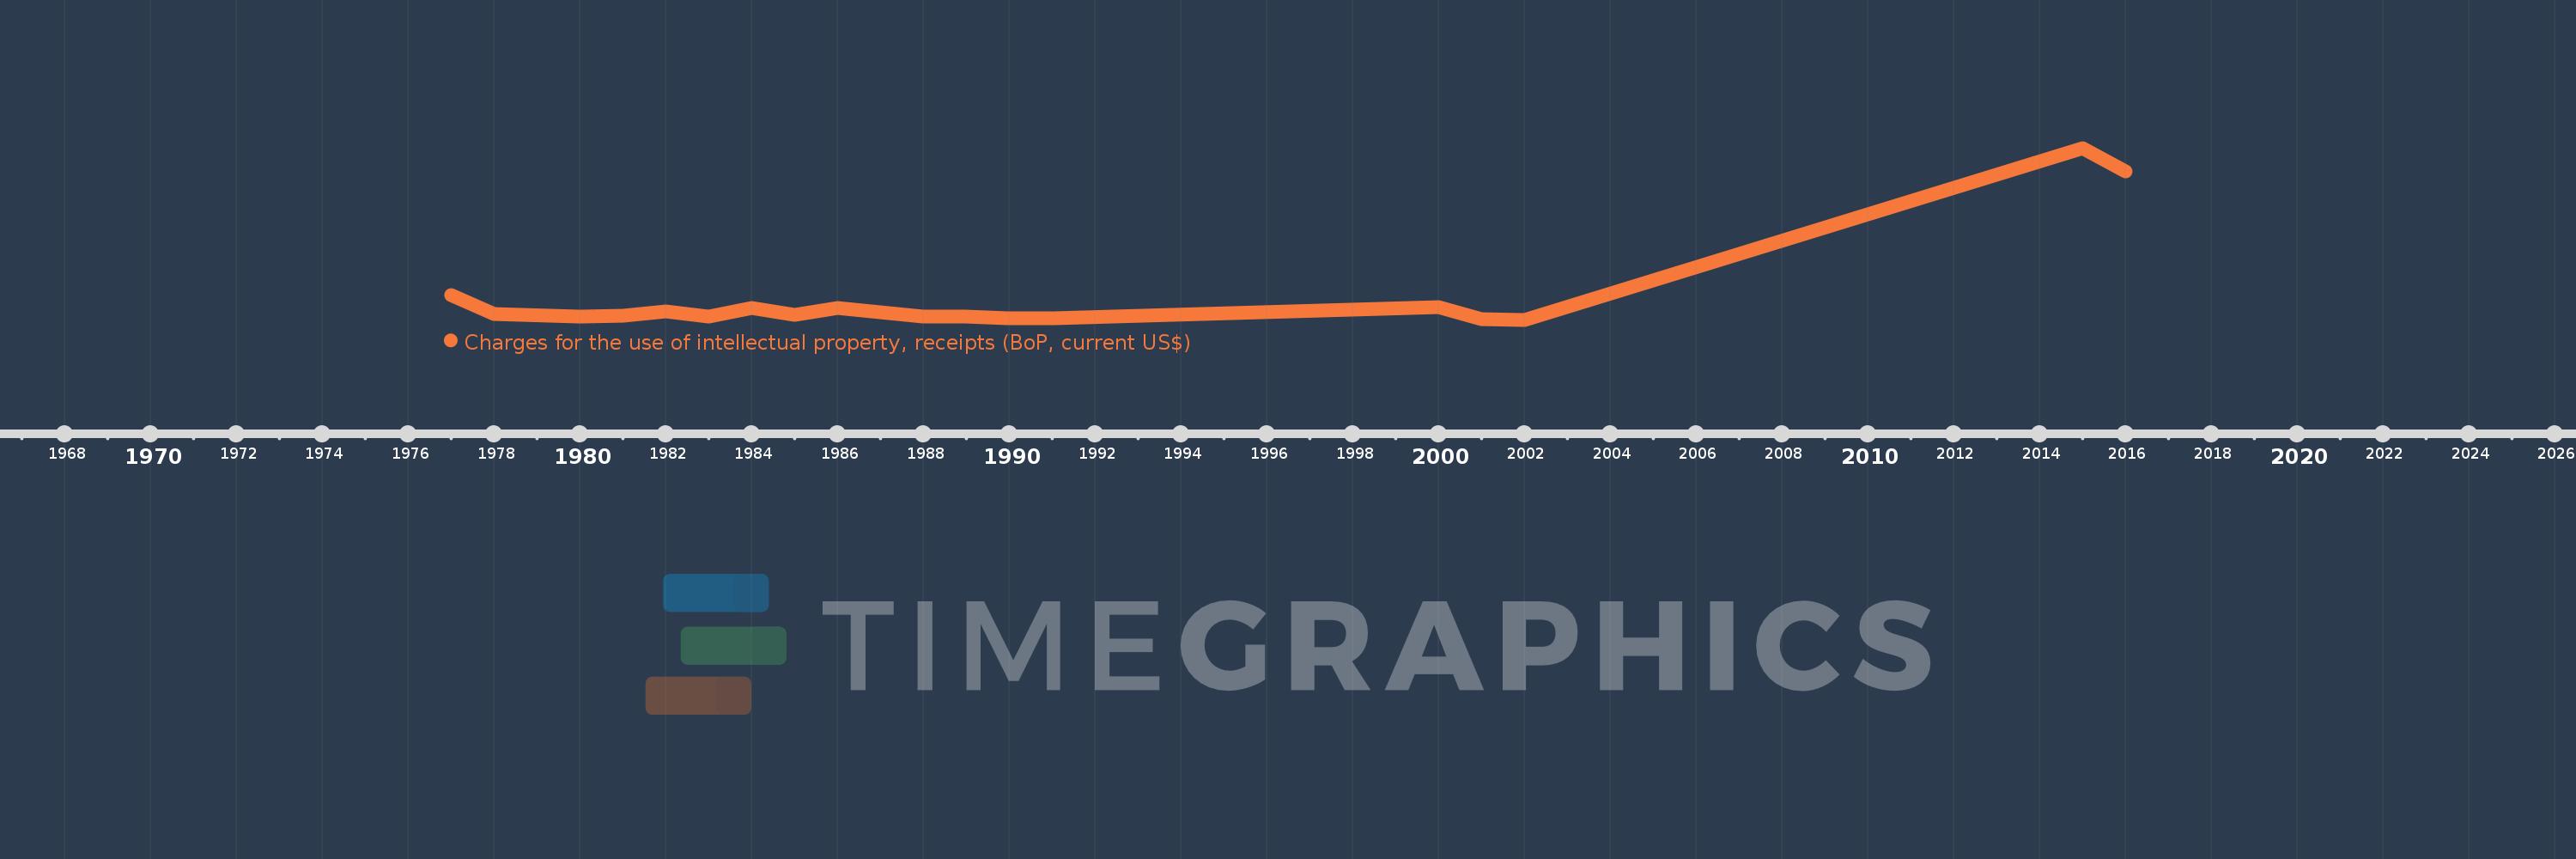
Charges for the use of intellectual property, receipts (BoP, current US$)
2016,2015,2002,2001,2000,1991,1990,1989,1988,1986,1985,1984,1983,1982,1981,1980,1978,1977
Queste statistiche in altri paesi:
Linea del tempo:
Questa scala temporale mostra un grafico dal 1977 anno al 2016 anno. Myanmar. I dati fino ad 1976 anno non disponibili. Il numero di osservazioni attuali secondo i date: 18.
La fonte (nome):
Indicatori dello sviluppo mondiale
La fonte (organizzazione):
International Monetary Fund, Balance of Payments Statistics Yearbook and data files.
Categorie:
Economy & Growth, Science & Technology
sono stati aggiornati
23 apr 2017 anni
Indicatori delle variazioni dei valori per anni
Minima:
29.453 Mille.
1 gen 2002 anni
Massimo:
24.978 Mln
1 gen 2015 anni
Alla data di osservazione
Valore
Variazione assoluta
La variazione rispetto al valore precedente
1 gen 1977 anni
3.588 Mln
+3.588 Mln
0.0%
1 gen 1978 anni
839.59 Mille.
-2.748 Mln
-76.6%
1 gen 1980 anni
532.748 Mille.
-306.842 Mille.
-36.55%
1 gen 1981 anni
657.828 Mille.
+125.08 Mille.
23.48%
1 gen 1982 anni
1.28 Mln
+621.762 Mille.
94.52%
1 gen 1983 anni
456.0 Mille.
-823.59 Mille.
-64.36%
1 gen 1984 anni
1.743 Mln
+1.287 Mln
282.29%
1 gen 1985 anni
733.158 Mille.
-1.01 Mln
-57.94%
1 gen 1986 anni
1.704 Mln
+970.984 Mille.
132.44%
1 gen 1988 anni
437.266 Mille.
-1.267 Mln
-74.34%
1 gen 1989 anni
486.039 Mille.
+48.773 Mille.
11.15%
1 gen 1990 anni
181.406 Mille.
-304.633 Mille.
-62.68%
1 gen 1991 anni
216.627 Mille.
+35.221 Mille.
19.42%
1 gen 2000 anni
1.821 Mln
+1.605 Mln
740.72%
1 gen 2001 anni
109.146 Mille.
-1.712 Mln
-94.01%
1 gen 2002 anni
29.453 Mille.
-79.693 Mille.
-73.01%
1 gen 2015 anni
24.978 Mln
+24.949 Mln
84.71 Mille.%
1 gen 2016 anni
21.6 Mln
-3.378 Mln
-13.52%
Classificazione dei paesi secondo i statistiche attuali per anni


Commenti: