29
/it/
it
AIzaSyAYiBZKx7MnpbEhh9jyipgxe19OcubqV5w
April 1, 2024
201696
Morocco
MAR
true
2
1
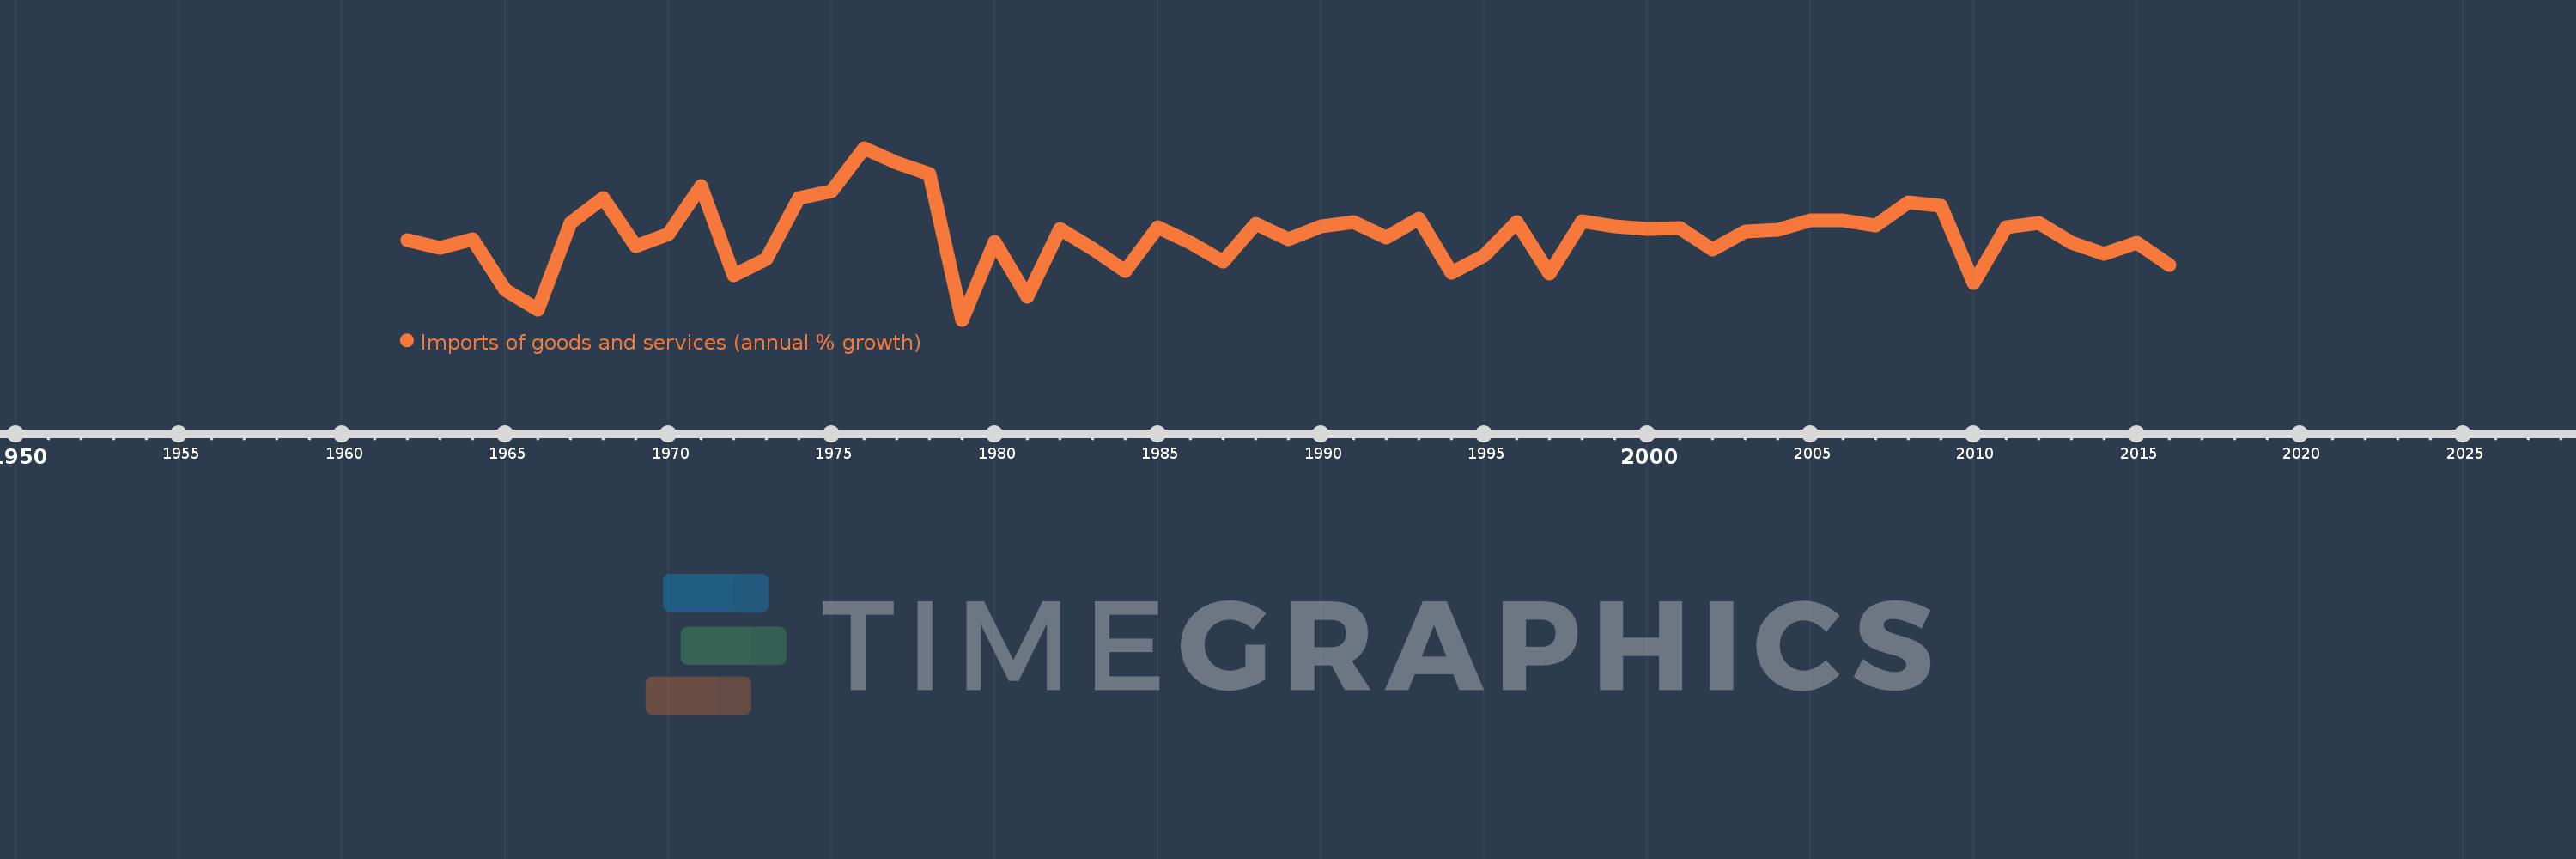
Imports of goods and services (annual % growth)
2016,2015,2014,2013,2012,2011,2010,2009,2008,2007,2006,2005,2004,2003,2002,2001,2000,1999,1998,1997,1996,1995,1994,1993,1992,1991,1990,1989,1988,1987,1986,1985,1984,1983,1982,1981,1980,1979,1978,1977,1976,1975,1974,1973,1972,1971,1970,1969,1968,1967,1966,1965,1964,1963,1962
Queste statistiche in altri paesi:
AlbaniaAlgeriaAngolaAntigua and BarbudaArab WorldArgentinaArmeniaAustraliaAustriaAzerbaijanBahamas, TheBahrainBangladeshBarbadosBelarusBelgiumBelizeBeninBhutanBoliviaBosnia and HerzegovinaBotswanaBrazilBrunei DarussalamBulgariaBurkina FasoBurundiCabo VerdeCambodiaCameroonCanadaCaribbean small statesCentral Europe and the BalticsChadChileColombiaComorosCongo, Dem. Rep.Congo, Rep.Costa RicaCote d'IvoireCroatiaCubaCyprusCzech RepublicDenmarkDjiboutiDominican RepublicEarly-demographic dividendEast Asia & PacificEcuadorEgypt, Arab Rep.El SalvadorEquatorial GuineaEritreaEstoniaEthiopiaEuro areaEurope & Central AsiaEurope & Central Asia (excluding high income)Europe & Central Asia (IDA & IBRD countries)European UnionFijiFinlandFranceGabonGambia, TheGeorgiaGermanyGhanaGreeceGuatemalaGuineaGuinea-BissauHaitiHeavily indebted poor countries (HIPC)High incomeHondurasHong Kong SAR, ChinaHungaryIBRD onlyIcelandIDA & IBRD totalIDA blendIDA onlyIDA totalIndiaIndonesiaIran, Islamic Rep.IrelandIsraelItalyJamaicaJapanJordanKazakhstanKenyaKorea, Rep.KosovoKuwaitKyrgyz RepublicLao PDRLatin America & Caribbean Latin America & Caribbean (excluding high income)Latin America & the Caribbean (IDA & IBRD countries)LatviaLeast developed countries: UN classificationLebanonLiberiaLibyaLithuaniaLow & middle incomeLow incomeLower middle incomeLuxembourgMacao SAR, ChinaMacedonia, FYRMadagascarMalawiMalaysiaMaliMaltaMauritaniaMauritiusMexicoMiddle East & North AfricaMiddle East & North Africa (excluding high income)Middle East & North Africa (IDA & IBRD countries)Middle incomeMoldovaMongoliaMontenegroMoroccoMozambiqueMyanmarNamibiaNepalNetherlandsNew ZealandNicaraguaNigerNigeriaNorth AmericaNorwayOECD membersOmanOther small statesPakistanPanamaPapua New GuineaParaguayPeruPhilippinesPolandPortugalPost-demographic dividendPre-demographic dividendPuerto RicoQatarRomaniaRussian FederationRwandaSamoaSaudi ArabiaSenegalSerbiaSeychellesSierra LeoneSingaporeSlovak RepublicSloveniaSmall statesSomaliaSouth AfricaSouth AsiaSouth Asia (IDA & IBRD)South SudanSpainSri LankaSub-Saharan Africa Sub-Saharan Africa (excluding high income)Sub-Saharan Africa (IDA & IBRD countries)SudanSurinameSwazilandSwedenSwitzerlandSyrian Arab RepublicTajikistanTanzaniaThailandTimor-LesteTogoTrinidad and TobagoTunisiaTurkeyTurkmenistanUgandaUkraineUnited Arab EmiratesUnited KingdomUnited StatesUruguayUzbekistanVanuatuVenezuela, RBVietnamWest Bank and GazaWorldZambiaZimbabwe Linea del tempo:
Questa scala temporale mostra un grafico dal 1962 anno al 2016 anno. Morocco. I dati fino ad 1961 anno non disponibili. Il numero di osservazioni attuali secondo i date: 55.
La fonte (nome):
Indicatori dello sviluppo mondiale
La fonte (organizzazione):
World Bank national accounts data, and OECD National Accounts data files.
Categorie:
Economy & Growth, Trade
sono stati aggiornati
23 apr 2017 anni
Indicatori delle variazioni dei valori per anni
Minima:
-19.011
1 gen 1979 anni
Massimo:
30.681
1 gen 1976 anni
Alla data di osservazione
Valore
Variazione assoluta
La variazione rispetto al valore precedente
1 gen 1962 anni
3.955
+3.955
0.0%
1 gen 1963 anni
1.773
-2.182
-55.17%
1 gen 1964 anni
4.174
+2.401
135.42%
1 gen 1965 anni
-10.418
-14.592
-349.57%
1 gen 1966 anni
-16.025
-5.607
53.83%
1 gen 1967 anni
9.036
+25.061
-156.38%
1 gen 1968 anni
16.175
+7.139
79.01%
1 gen 1969 anni
2.292
-13.883
-85.83%
1 gen 1970 anni
5.801
+3.509
153.11%
1 gen 1971 anni
19.652
+13.851
238.77%
1 gen 1972 anni
-6.057
-25.71
-130.82%
1 gen 1973 anni
-1.526
+4.532
-74.81%
1 gen 1974 anni
16.245
+17.771
-1.16 Mille.%
1 gen 1975 anni
18.231
+1.985
12.22%
1 gen 1976 anni
30.681
+12.45
68.29%
1 gen 1977 anni
26.28
-4.402
-14.35%
1 gen 1978 anni
23.03
-3.25
-12.37%
1 gen 1979 anni
-19.011
-42.041
-182.55%
1 gen 1980 anni
3.599
+22.61
-118.93%
1 gen 1981 anni
-12.358
-15.957
-443.38%
1 gen 1982 anni
7.218
+19.576
-158.41%
1 gen 1983 anni
1.467
-5.751
-79.67%
1 gen 1984 anni
-5.031
-6.498
-442.86%
1 gen 1985 anni
7.708
+12.739
-253.23%
1 gen 1986 anni
3.197
-4.512
-58.53%
1 gen 1987 anni
-2.079
-5.276
-165.03%
1 gen 1988 anni
8.713
+10.792
-519.12%
1 gen 1989 anni
4.371
-4.342
-49.83%
1 gen 1990 anni
8.009
+3.638
83.22%
1 gen 1991 anni
9.176
+1.167
14.57%
1 gen 1992 anni
4.88
-4.297
-46.82%
1 gen 1993 anni
10.194
+5.315
108.91%
1 gen 1994 anni
-5.299
-15.493
-151.98%
1 gen 1995 anni
-0.472
+4.827
-91.09%
1 gen 1996 anni
9.151
+9.623
-2.04 Mille.%
1 gen 1997 anni
-5.768
-14.92
-163.03%
1 gen 1998 anni
9.598
+15.367
-266.4%
1 gen 1999 anni
8.08
-1.519
-15.82%
1 gen 2000 anni
7.143
-0.937
-11.6%
1 gen 2001 anni
7.583
+0.44
6.16%
1 gen 2002 anni
1.364
-6.219
-82.01%
1 gen 2003 anni
6.546
+5.182
379.87%
1 gen 2004 anni
7.1
+0.554
8.47%
1 gen 2005 anni
9.776
+2.676
37.69%
1 gen 2006 anni
9.636
-0.14
-1.43%
1 gen 2007 anni
8.24
-1.396
-14.49%
1 gen 2008 anni
15.017
+6.777
82.25%
1 gen 2009 anni
13.848
-1.169
-7.78%
1 gen 2010 anni
-8.364
-22.212
-160.4%
1 gen 2011 anni
7.828
+16.192
-193.59%
1 gen 2012 anni
9.075
+1.247
15.93%
1 gen 2013 anni
3.35
-5.726
-63.09%
1 gen 2014 anni
-0.071
-3.421
-102.13%
1 gen 2015 anni
3.268
+3.339
-4.67 Mille.%
1 gen 2016 anni
-3.141
-6.409
-196.13%
Classificazione dei paesi secondo i statistiche attuali per anni


Commenti: