29
/it/
it
AIzaSyAYiBZKx7MnpbEhh9jyipgxe19OcubqV5w
April 1, 2024
198229
Moldova
MDA
true
2
1
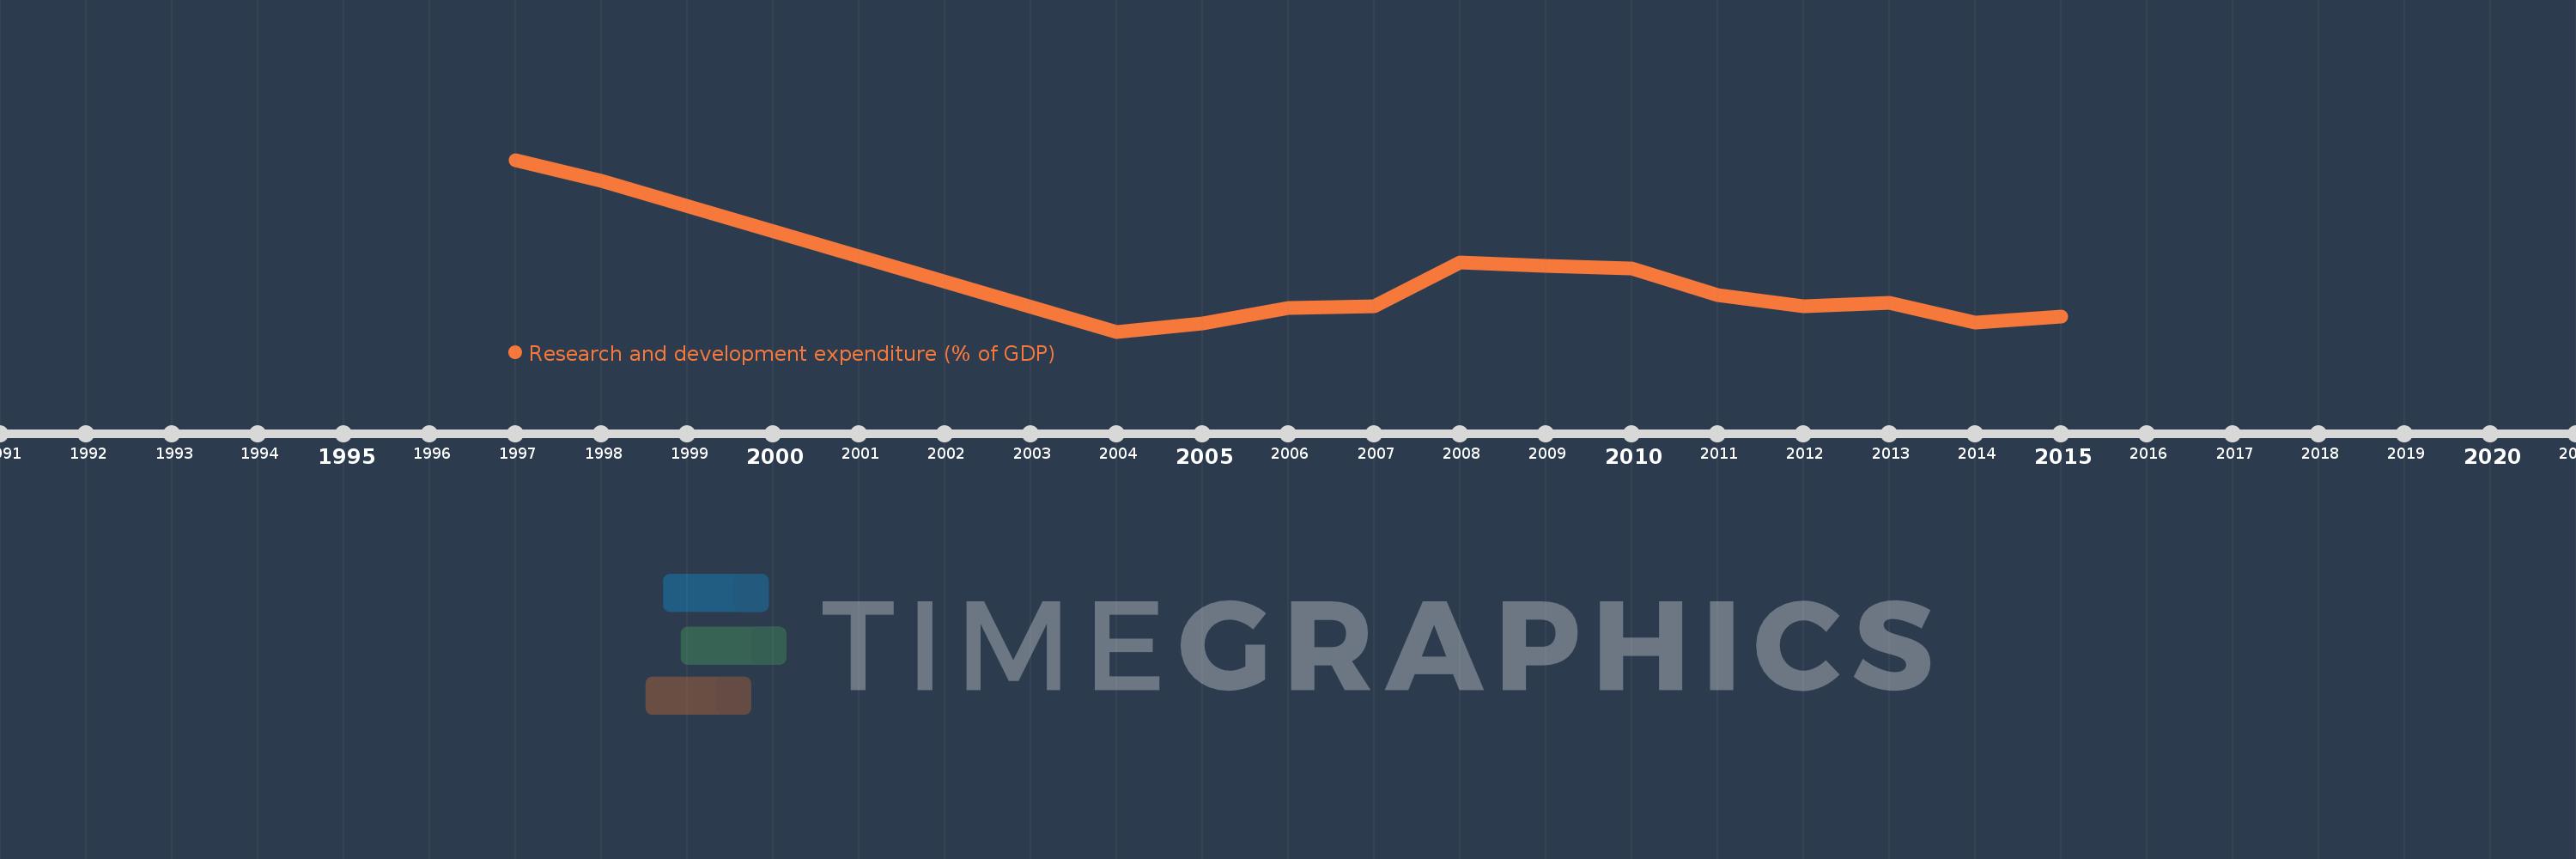
Research and development expenditure (% of GDP)
2015,2014,2013,2012,2011,2010,2009,2008,2007,2006,2005,2004,1998,1997
Queste statistiche in altri paesi:
Linea del tempo:
Questa scala temporale mostra un grafico dal 1997 anno al 2015 anno. Moldova. I dati fino ad 1996 anno non disponibili. Il numero di osservazioni attuali secondo i date: 14.
La fonte (nome):
Indicatori dello sviluppo mondiale
La fonte (organizzazione):
United Nations Educational, Scientific, and Cultural Organization (UNESCO) Institute for Statistics.
Categorie:
Science & Technology
sono stati aggiornati
23 apr 2017 anni
Indicatori delle variazioni dei valori per anni
Minima:
0.324
1 gen 2004 anni
Massimo:
0.873
1 gen 1997 anni
Alla data di osservazione
Valore
Variazione assoluta
La variazione rispetto al valore precedente
1 gen 1997 anni
0.873
+0.873
0.0%
1 gen 1998 anni
0.807
-0.066
-7.58%
1 gen 2004 anni
0.324
-0.483
-59.83%
1 gen 2005 anni
0.349
+0.025
7.71%
1 gen 2006 anni
0.399
+0.05
14.22%
1 gen 2007 anni
0.406
+0.008
1.9%
1 gen 2008 anni
0.546
+0.139
34.31%
1 gen 2009 anni
0.535
-0.011
-2.01%
1 gen 2010 anni
0.526
-0.009
-1.69%
1 gen 2011 anni
0.44
-0.086
-16.31%
1 gen 2012 anni
0.405
-0.035
-7.93%
1 gen 2013 anni
0.417
+0.012
3.05%
1 gen 2014 anni
0.354
-0.063
-15.13%
1 gen 2015 anni
0.372
+0.017
4.89%
Classificazione dei paesi secondo i statistiche attuali per anni


Commenti: