29
/it/
it
AIzaSyAYiBZKx7MnpbEhh9jyipgxe19OcubqV5w
April 1, 2024
198045
Moldova
MDA
true
2
1
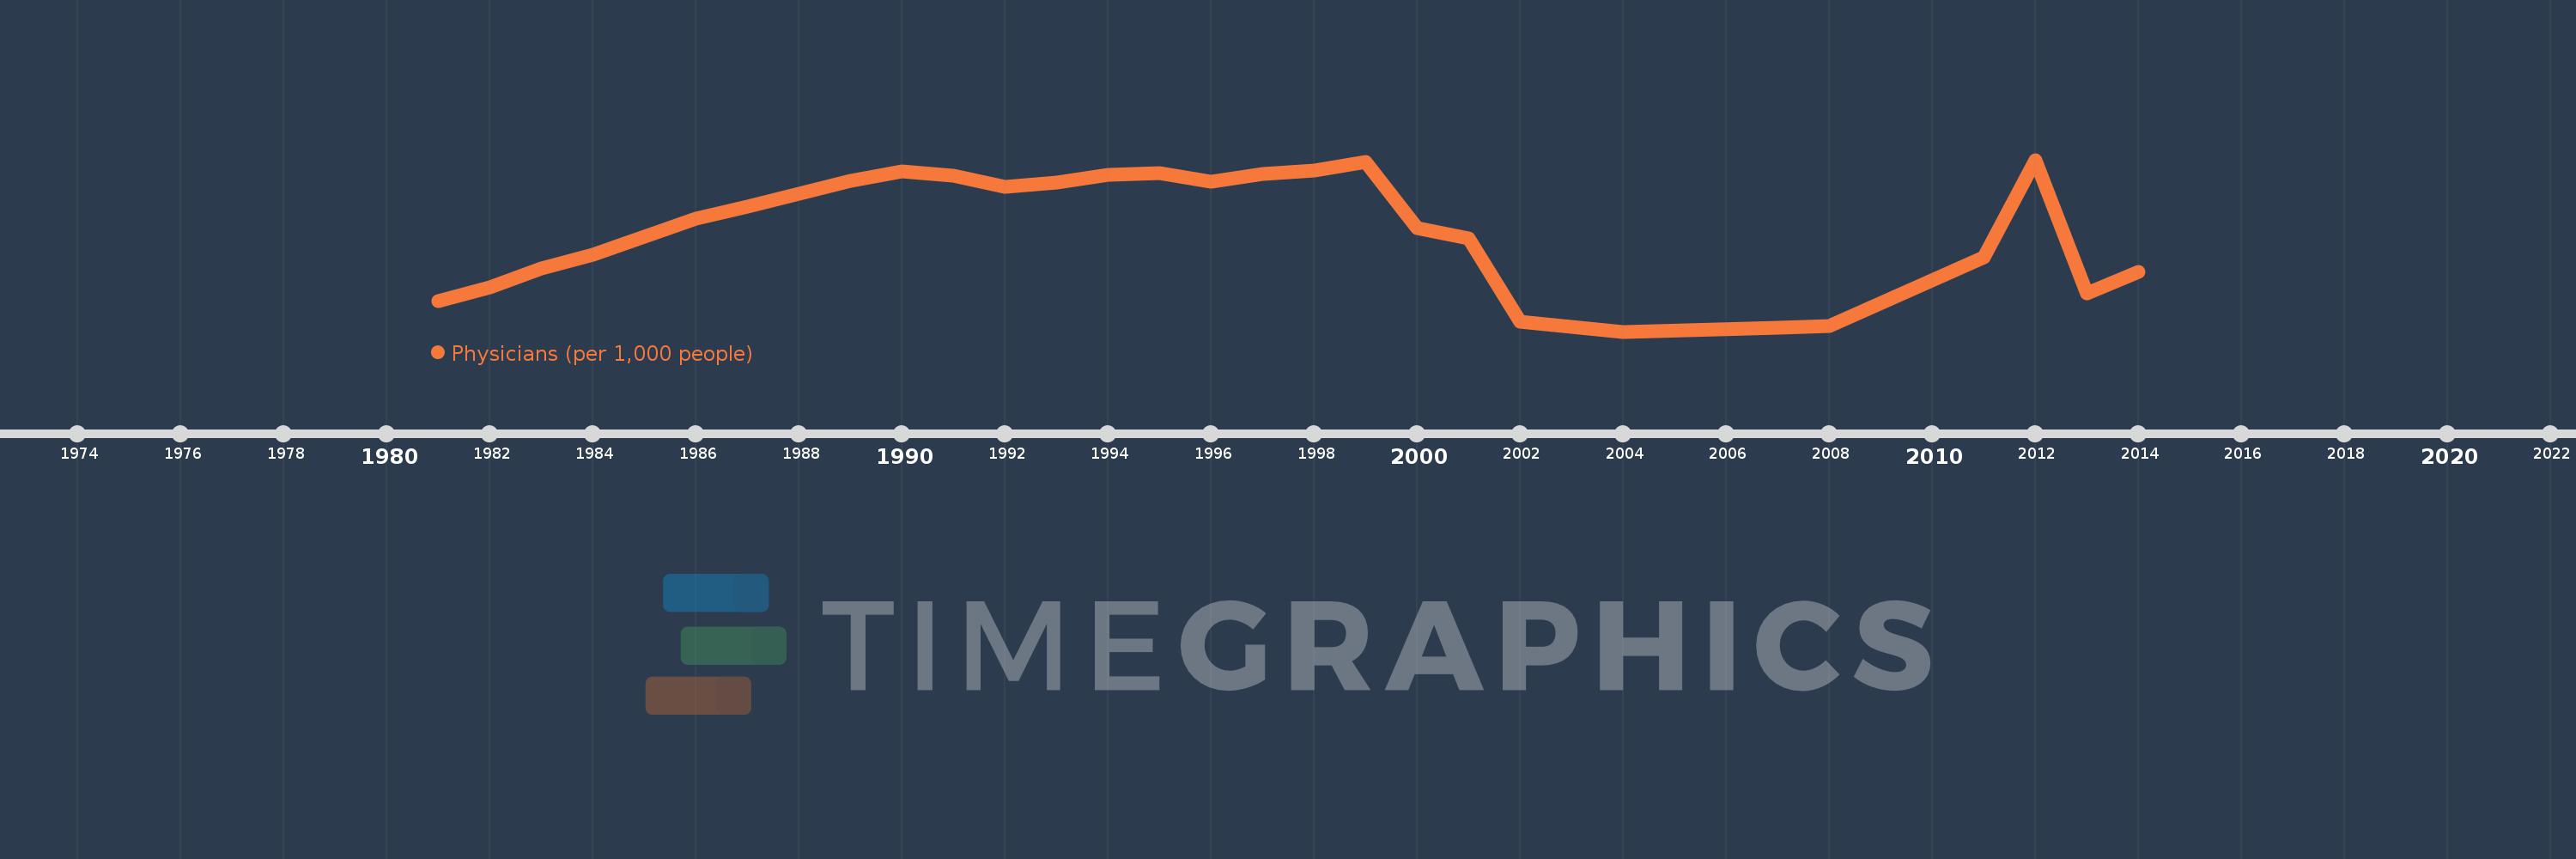
Physicians (per 1,000 people)
2014,2013,2012,2011,2008,2007,2004,2002,2001,2000,1999,1998,1997,1996,1995,1994,1993,1992,1991,1990,1989,1988,1987,1986,1985,1984,1983,1982,1981
Queste statistiche in altri paesi:
AfghanistanAlbaniaAlgeriaAmerican SamoaAndorraAngolaAntigua and BarbudaArab WorldArgentinaArmeniaArubaAustraliaAustriaAzerbaijanBahamas, TheBahrainBangladeshBarbadosBelarusBelgiumBelizeBeninBermudaBhutanBoliviaBosnia and HerzegovinaBotswanaBrazilBrunei DarussalamBulgariaBurkina FasoBurundiCabo VerdeCambodiaCameroonCanadaCaribbean small statesCayman IslandsCentral African RepublicCentral Europe and the BalticsChadChannel IslandsChileChinaColombiaComorosCongo, Dem. Rep.Congo, Rep.Costa RicaCote d'IvoireCroatiaCubaCyprusCzech RepublicDenmarkDjiboutiDominicaDominican RepublicEarly-demographic dividendEast Asia & PacificEast Asia & Pacific (excluding high income)East Asia & Pacific (IDA & IBRD countries)EcuadorEgypt, Arab Rep.El SalvadorEquatorial GuineaEritreaEstoniaEthiopiaEuro areaEurope & Central AsiaEurope & Central Asia (excluding high income)Europe & Central Asia (IDA & IBRD countries)European UnionFijiFinlandFragile and conflict affected situationsFranceFrench PolynesiaGabonGambia, TheGeorgiaGermanyGhanaGreeceGreenlandGrenadaGuamGuatemalaGuineaGuinea-BissauGuyanaHaitiHeavily indebted poor countries (HIPC)High incomeHondurasHong Kong SAR, ChinaHungaryIBRD onlyIcelandIDA & IBRD totalIDA blendIDA onlyIDA totalIndiaIndonesiaIran, Islamic Rep.IraqIrelandIsraelItalyJamaicaJapanJordanKazakhstanKenyaKiribatiKorea, Dem. People’s Rep.Korea, Rep.KuwaitKyrgyz RepublicLao PDRLate-demographic dividendLatin America & Caribbean Latin America & Caribbean (excluding high income)Latin America & the Caribbean (IDA & IBRD countries)LatviaLeast developed countries: UN classificationLebanonLesothoLiberiaLibyaLithuaniaLow & middle incomeLow incomeLower middle incomeLuxembourgMacao SAR, ChinaMacedonia, FYRMadagascarMalawiMalaysiaMaldivesMaliMaltaMarshall IslandsMauritaniaMauritiusMexicoMicronesia, Fed. Sts.Middle East & North AfricaMiddle East & North Africa (excluding high income)Middle East & North Africa (IDA & IBRD countries)Middle incomeMoldovaMonacoMongoliaMontenegroMoroccoMozambiqueMyanmarNamibiaNauruNepalNetherlandsNew CaledoniaNew ZealandNicaraguaNigerNigeriaNorth AmericaNorthern Mariana IslandsNorwayOECD membersOmanOther small statesPacific island small statesPakistanPalauPanamaPapua New GuineaParaguayPeruPhilippinesPolandPortugalPost-demographic dividendPre-demographic dividendPuerto RicoQatarRomaniaRussian FederationRwandaSamoaSan MarinoSao Tome and PrincipeSaudi ArabiaSenegalSerbiaSeychellesSierra LeoneSingaporeSlovak RepublicSloveniaSmall statesSolomon IslandsSomaliaSouth AfricaSouth AsiaSouth Asia (IDA & IBRD)SpainSri LankaSt. Kitts and NevisSt. LuciaSt. Vincent and the GrenadinesSub-Saharan Africa Sub-Saharan Africa (excluding high income)Sub-Saharan Africa (IDA & IBRD countries)SudanSurinameSwazilandSwedenSwitzerlandSyrian Arab RepublicTajikistanTanzaniaThailandTimor-LesteTogoTongaTrinidad and TobagoTunisiaTurkeyTurkmenistanTuvaluUgandaUkraineUnited Arab EmiratesUnited KingdomUnited StatesUpper middle incomeUruguayUzbekistanVanuatuVenezuela, RBVietnamVirgin Islands (U.S.)West Bank and GazaWorldYemen, Rep.ZambiaZimbabwe Linea del tempo:
Questa scala temporale mostra un grafico dal 1981 anno al 2014 anno. Moldova. I dati fino ad 1980 anno non disponibili. Il numero di osservazioni attuali secondo i date: 29.
La fonte (nome):
Indicatori dello sviluppo mondiale
La fonte (organizzazione):
World Health Organization's Global Health Workforce Statistics, OECD, supplemented by country data.
Categorie:
Health
sono stati aggiornati
23 apr 2017 anni
Indicatori delle variazioni dei valori per anni
Minima:
2.636
1 gen 2004 anni
Massimo:
3.643
1 gen 2012 anni
Alla data di osservazione
Valore
Variazione assoluta
La variazione rispetto al valore precedente
1 gen 1981 anni
2.816
+2.816
0.0%
1 gen 1982 anni
2.895
+0.08
2.83%
1 gen 1983 anni
3.007
+0.112
3.85%
1 gen 1984 anni
3.089
+0.082
2.74%
1 gen 1985 anni
3.193
+0.104
3.37%
1 gen 1986 anni
3.297
+0.103
3.24%
1 gen 1987 anni
3.37
+0.074
2.23%
1 gen 1988 anni
3.444
+0.073
2.17%
1 gen 1989 anni
3.52
+0.077
2.23%
1 gen 1990 anni
3.573
+0.053
1.51%
1 gen 1991 anni
3.55
-0.023
-0.65%
1 gen 1992 anni
3.484
-0.066
-1.86%
1 gen 1993 anni
3.51
+0.025
0.73%
1 gen 1994 anni
3.555
+0.046
1.3%
1 gen 1995 anni
3.564
+0.009
0.25%
1 gen 1996 anni
3.513
-0.051
-1.44%
1 gen 1997 anni
3.562
+0.049
1.39%
1 gen 1998 anni
3.582
+0.02
0.56%
1 gen 1999 anni
3.631
+0.049
1.37%
1 gen 2000 anni
3.245
-0.386
-10.63%
1 gen 2001 anni
3.18
-0.065
-2.0%
1 gen 2002 anni
2.694
-0.486
-15.28%
1 gen 2004 anni
2.636
-0.058
-2.15%
1 gen 2007 anni
2.66
+0.024
0.91%
1 gen 2008 anni
2.668
+0.008
0.3%
1 gen 2011 anni
3.072
+0.404
15.14%
1 gen 2012 anni
3.643
+0.571
18.59%
1 gen 2013 anni
2.859
-0.784
-21.52%
1 gen 2014 anni
2.984
+0.125
4.37%
Classificazione dei paesi secondo i statistiche attuali per anni


Commenti: