29
/it/
it
AIzaSyAYiBZKx7MnpbEhh9jyipgxe19OcubqV5w
April 1, 2024
193304
Mauritania
MRT
true
2
1
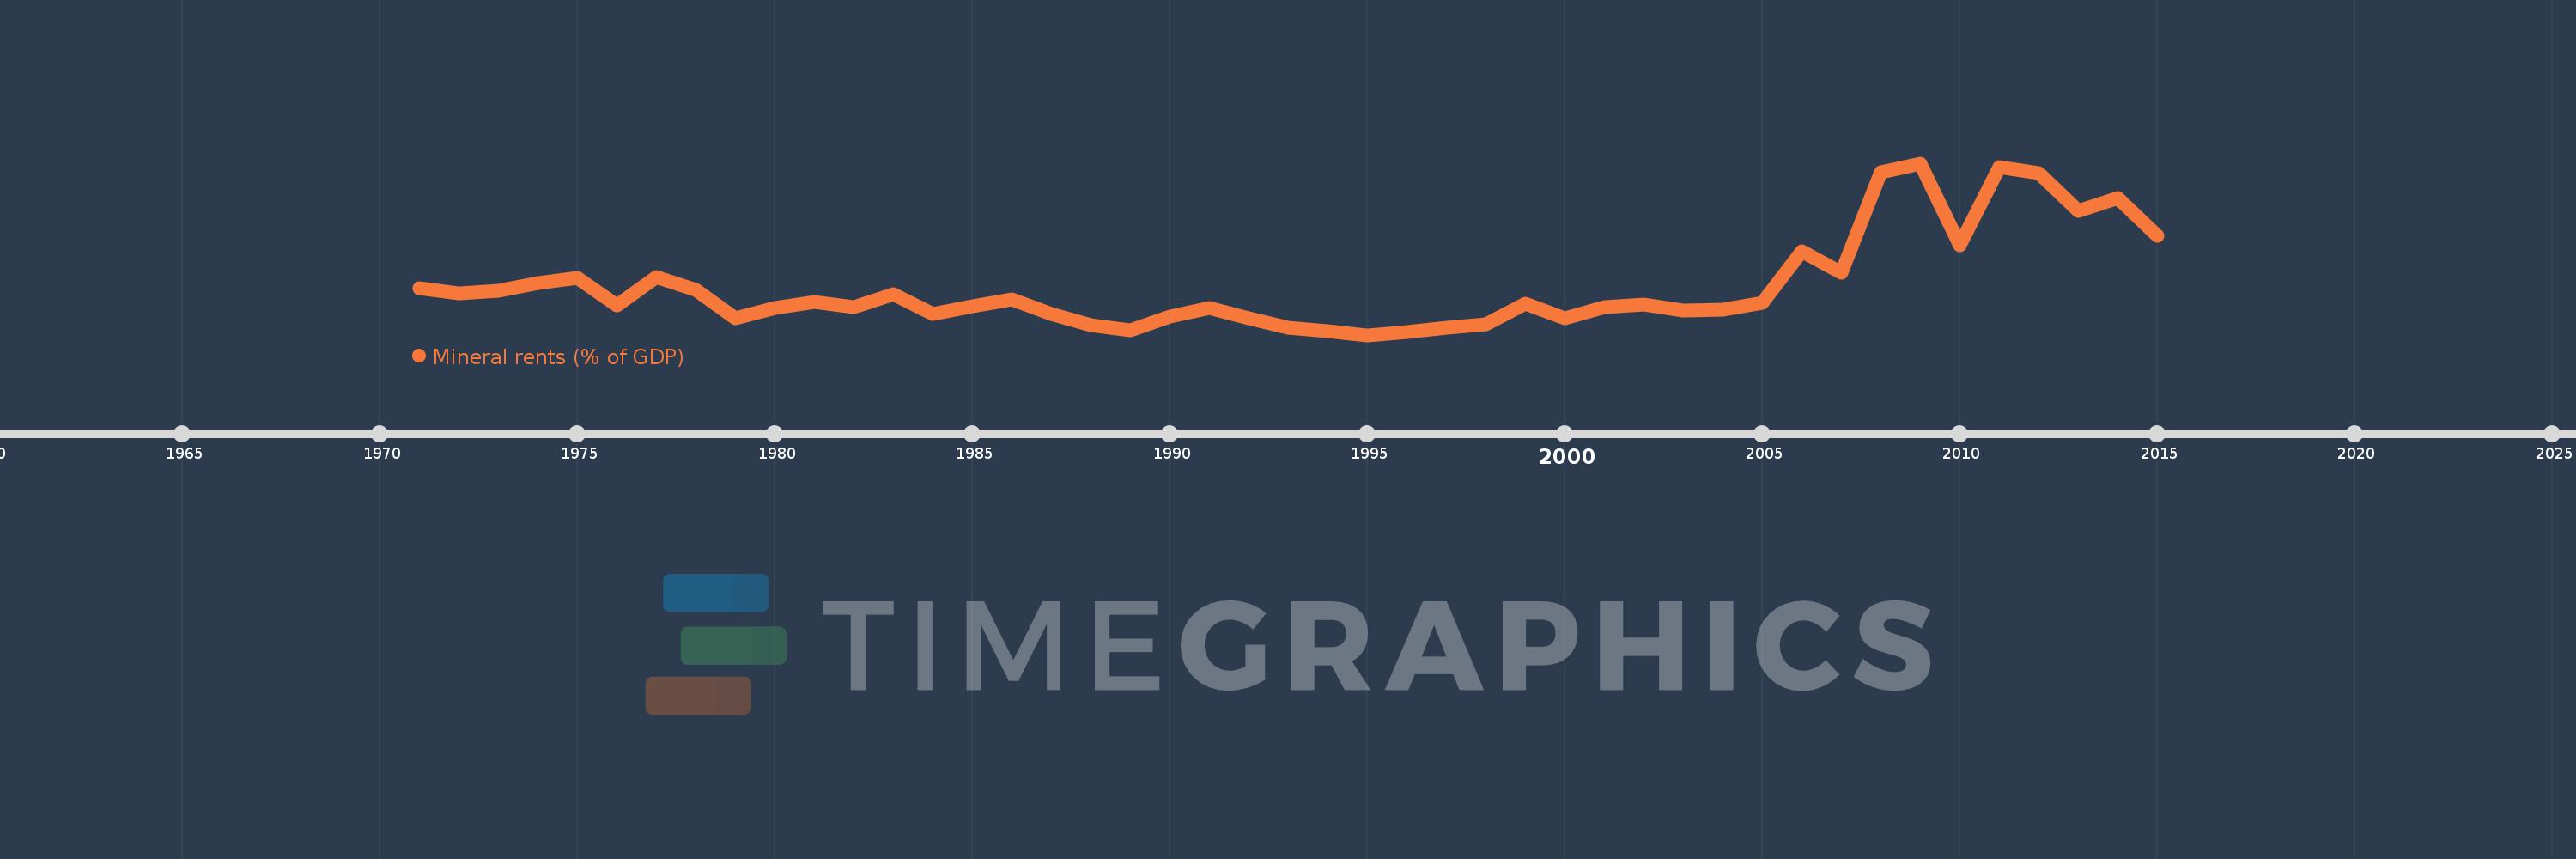
Mineral rents (% of GDP)
2015,2014,2013,2012,2011,2010,2009,2008,2007,2006,2005,2004,2003,2002,2001,2000,1999,1998,1997,1996,1995,1994,1993,1992,1991,1990,1989,1988,1987,1986,1985,1984,1983,1982,1981,1980,1979,1978,1977,1976,1975,1974,1973,1972,1971
Queste statistiche in altri paesi:
AfghanistanAlbaniaAlgeriaAndorraAngolaAntigua and BarbudaArab WorldArgentinaArmeniaArubaAustraliaAustriaAzerbaijanBahamas, TheBahrainBangladeshBarbadosBelarusBelgiumBelizeBeninBermudaBhutanBoliviaBosnia and HerzegovinaBotswanaBrazilBrunei DarussalamBulgariaBurkina FasoBurundiCabo VerdeCambodiaCameroonCanadaCaribbean small statesCayman IslandsCentral African RepublicCentral Europe and the BalticsChadChannel IslandsChileChinaColombiaComorosCongo, Dem. Rep.Congo, Rep.Costa RicaCote d'IvoireCroatiaCubaCyprusCzech RepublicDenmarkDjiboutiDominicaDominican RepublicEarly-demographic dividendEast Asia & PacificEast Asia & Pacific (excluding high income)East Asia & Pacific (IDA & IBRD countries)EcuadorEgypt, Arab Rep.El SalvadorEquatorial GuineaEritreaEstoniaEthiopiaEuro areaEurope & Central AsiaEurope & Central Asia (excluding high income)Europe & Central Asia (IDA & IBRD countries)European UnionFaroe IslandsFijiFinlandFragile and conflict affected situationsFranceFrench PolynesiaGabonGambia, TheGeorgiaGermanyGhanaGreeceGreenlandGrenadaGuatemalaGuineaGuinea-BissauGuyanaHaitiHeavily indebted poor countries (HIPC)High incomeHondurasHong Kong SAR, ChinaHungaryIBRD onlyIcelandIDA & IBRD totalIDA blendIDA onlyIDA totalIndiaIndonesiaIran, Islamic Rep.IraqIrelandIsle of ManIsraelItalyJamaicaJapanJordanKazakhstanKenyaKiribatiKorea, Rep.KosovoKuwaitKyrgyz RepublicLao PDRLate-demographic dividendLatin America & Caribbean Latin America & Caribbean (excluding high income)Latin America & the Caribbean (IDA & IBRD countries)LatviaLeast developed countries: UN classificationLebanonLesothoLiberiaLibyaLiechtensteinLithuaniaLow & middle incomeLow incomeLower middle incomeLuxembourgMacao SAR, ChinaMacedonia, FYRMadagascarMalawiMalaysiaMaldivesMaliMaltaMarshall IslandsMauritaniaMauritiusMexicoMicronesia, Fed. Sts.Middle East & North AfricaMiddle East & North Africa (excluding high income)Middle East & North Africa (IDA & IBRD countries)Middle incomeMoldovaMonacoMongoliaMontenegroMoroccoMozambiqueMyanmarNamibiaNepalNetherlandsNew CaledoniaNew ZealandNicaraguaNigerNigeriaNorth AmericaNorwayOECD membersOmanOther small statesPacific island small statesPakistanPalauPanamaPapua New GuineaParaguayPeruPhilippinesPolandPortugalPost-demographic dividendPre-demographic dividendPuerto RicoQatarRomaniaRussian FederationRwandaSamoaSan MarinoSao Tome and PrincipeSaudi ArabiaSenegalSerbiaSeychellesSierra LeoneSingaporeSlovak RepublicSloveniaSmall statesSolomon IslandsSomaliaSouth AfricaSouth AsiaSouth Asia (IDA & IBRD)South SudanSpainSri LankaSt. Kitts and NevisSt. LuciaSt. Vincent and the GrenadinesSub-Saharan Africa Sub-Saharan Africa (excluding high income)Sub-Saharan Africa (IDA & IBRD countries)SudanSurinameSwazilandSwedenSwitzerlandSyrian Arab RepublicTajikistanTanzaniaThailandTimor-LesteTogoTongaTrinidad and TobagoTunisiaTurkeyTurkmenistanTuvaluUgandaUkraineUnited Arab EmiratesUnited KingdomUnited StatesUpper middle incomeUruguayUzbekistanVanuatuVenezuela, RBVietnamVirgin Islands (U.S.)West Bank and GazaWorldYemen, Rep.ZambiaZimbabwe Linea del tempo:
Questa scala temporale mostra un grafico dal 1971 anno al 2015 anno. Mauritania. I dati fino ad 1970 anno non disponibili. Il numero di osservazioni attuali secondo i date: 45.
La fonte (nome):
Indicatori dello sviluppo mondiale
La fonte (organizzazione):
Estimates based on sources and methods described in "The Changing Wealth of Nations: Measuring Sustainable Development in the New Millennium" (World Bank, 2011).
Categorie:
Energy & Mining, Environment
sono stati aggiornati
23 apr 2017 anni
Indicatori delle variazioni dei valori per anni
Minima:
4.084
1 gen 1995 anni
Massimo:
44.644
1 gen 2009 anni
Alla data di osservazione
Valore
Variazione assoluta
La variazione rispetto al valore precedente
1 gen 1971 anni
15.184
+15.184
0.0%
1 gen 1972 anni
13.956
-1.228
-8.09%
1 gen 1973 anni
14.428
+0.472
3.38%
1 gen 1974 anni
16.349
+1.922
13.32%
1 gen 1975 anni
17.597
+1.248
7.63%
1 gen 1976 anni
11.151
-6.447
-36.63%
1 gen 1977 anni
17.849
+6.698
60.07%
1 gen 1978 anni
14.761
-3.088
-17.3%
1 gen 1979 anni
8.12
-6.641
-44.99%
1 gen 1980 anni
10.523
+2.403
29.6%
1 gen 1981 anni
11.93
+1.407
13.37%
1 gen 1982 anni
10.708
-1.221
-10.24%
1 gen 1983 anni
13.768
+3.059
28.57%
1 gen 1984 anni
8.981
-4.787
-34.77%
1 gen 1985 anni
10.973
+1.992
22.19%
1 gen 1986 anni
12.412
+1.439
13.12%
1 gen 1987 anni
9.01
-3.402
-27.41%
1 gen 1988 anni
6.315
-2.695
-29.92%
1 gen 1989 anni
5.1
-1.215
-19.24%
1 gen 1990 anni
8.527
+3.427
67.2%
1 gen 1991 anni
10.551
+2.024
23.73%
1 gen 1992 anni
7.999
-2.552
-24.19%
1 gen 1993 anni
5.831
-2.168
-27.1%
1 gen 1994 anni
4.966
-0.865
-14.84%
1 gen 1995 anni
4.084
-0.881
-17.75%
1 gen 1996 anni
4.783
+0.699
17.11%
1 gen 1997 anni
5.812
+1.029
21.51%
1 gen 1998 anni
6.685
+0.874
15.03%
1 gen 1999 anni
11.567
+4.881
73.01%
1 gen 2000 anni
8.042
-3.524
-30.47%
1 gen 2001 anni
10.772
+2.73
33.95%
1 gen 2002 anni
11.245
+0.473
4.39%
1 gen 2003 anni
9.816
-1.43
-12.71%
1 gen 2004 anni
9.971
+0.155
1.58%
1 gen 2005 anni
11.608
+1.637
16.41%
1 gen 2006 anni
23.854
+12.246
105.5%
1 gen 2007 anni
18.732
-5.122
-21.47%
1 gen 2008 anni
42.419
+23.688
126.46%
1 gen 2009 anni
44.644
+2.225
5.24%
1 gen 2010 anni
25.303
-19.341
-43.32%
1 gen 2011 anni
43.712
+18.41
72.76%
1 gen 2012 anni
42.237
-1.475
-3.37%
1 gen 2013 anni
33.308
-8.929
-21.14%
1 gen 2014 anni
36.337
+3.029
9.09%
1 gen 2015 anni
27.581
-8.756
-24.1%
Classificazione dei paesi secondo i statistiche attuali per anni


Commenti: