29
/it/
it
AIzaSyAYiBZKx7MnpbEhh9jyipgxe19OcubqV5w
April 1, 2024
193276
Mauritania
MRT
true
2
1
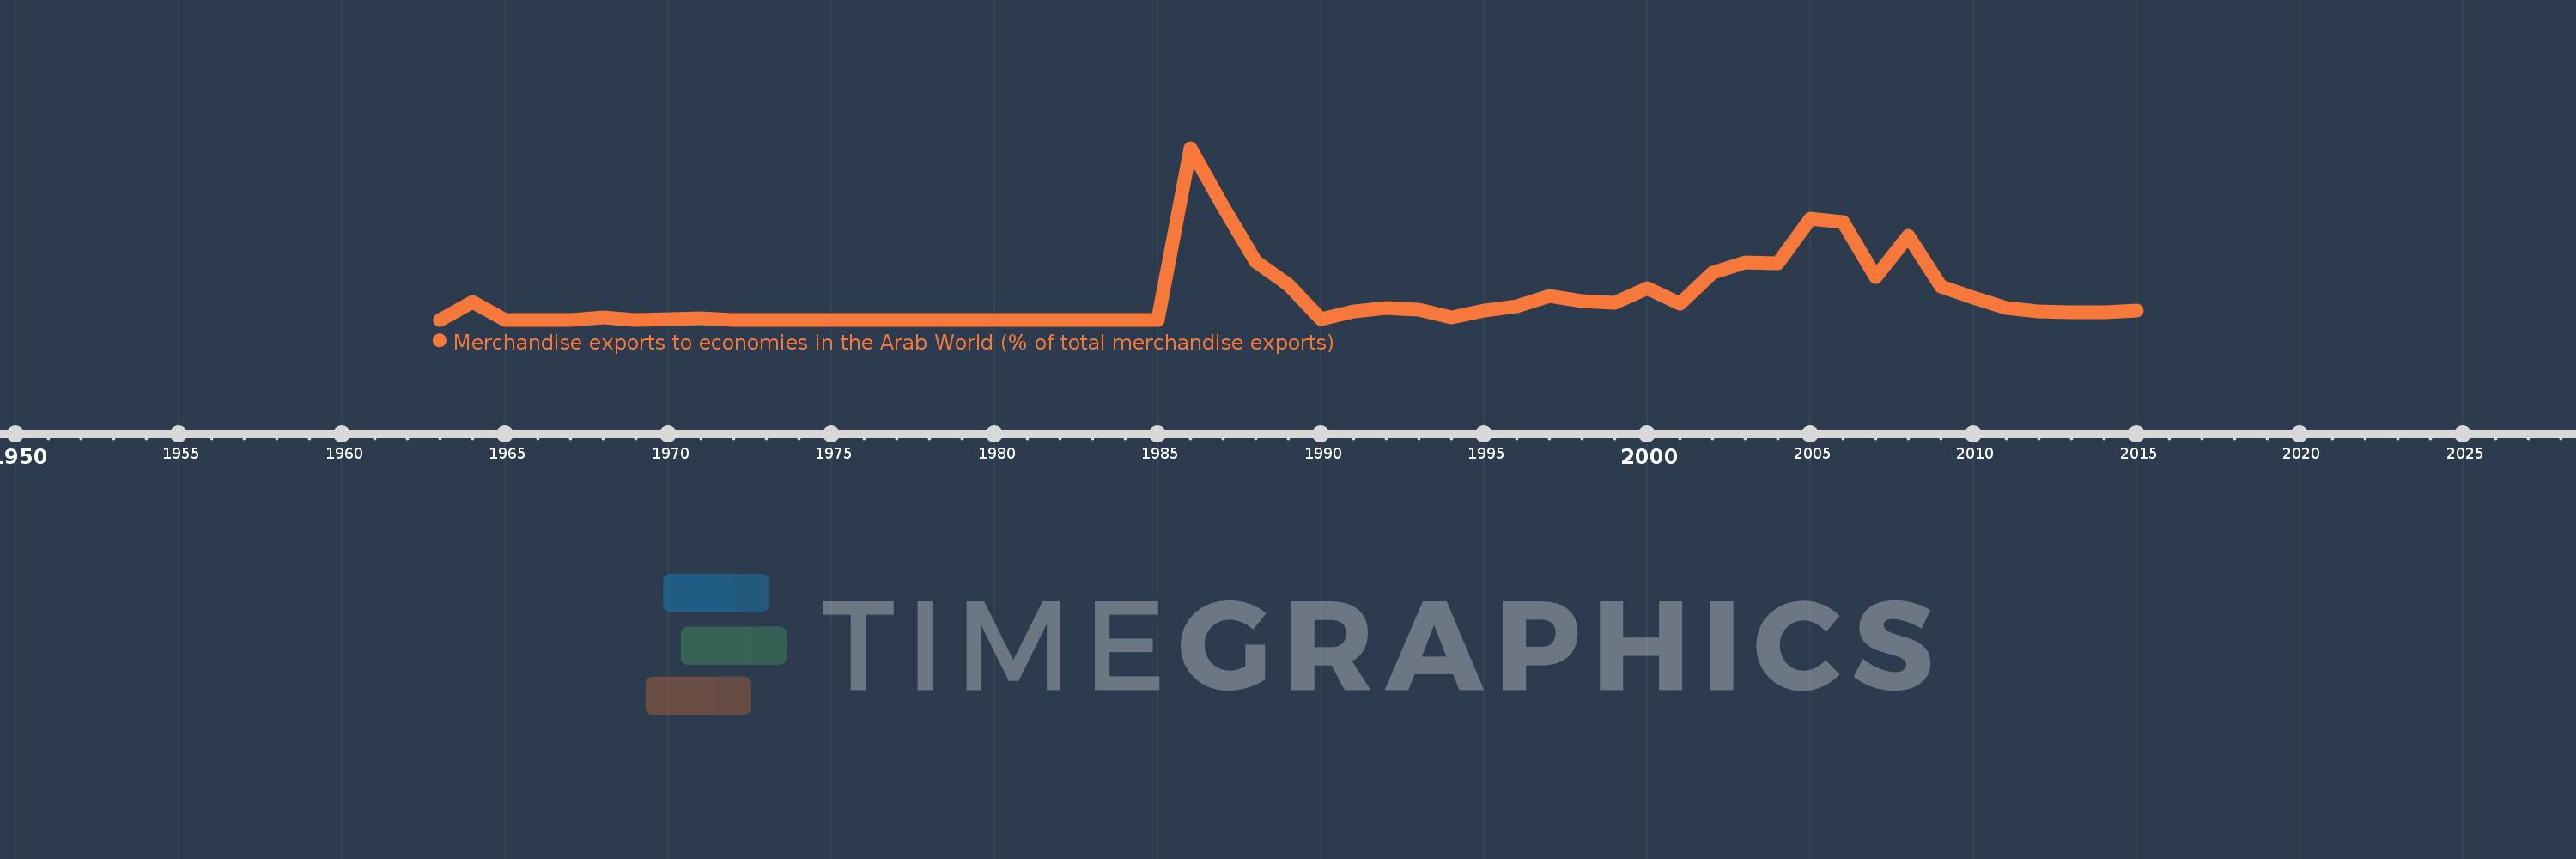
Merchandise exports to economies in the Arab World (% of total merchandise exports)
2015,2014,2013,2012,2011,2010,2009,2008,2007,2006,2005,2004,2003,2002,2001,2000,1999,1998,1997,1996,1995,1994,1993,1992,1991,1990,1989,1988,1987,1986,1985,1984,1983,1982,1975,1974,1973,1972,1971,1970,1969,1968,1967,1965,1964,1963
Queste statistiche in altri paesi:
AfghanistanAlbaniaAlgeriaAngolaArab WorldArgentinaArmeniaArubaAustraliaAustriaAzerbaijanBahamas, TheBahrainBangladeshBarbadosBelarusBelgiumBelizeBeninBermudaBoliviaBosnia and HerzegovinaBrazilBrunei DarussalamBulgariaBurkina FasoBurundiCabo VerdeCambodiaCameroonCanadaCaribbean small statesCentral African RepublicCentral Europe and the BalticsChadChileChinaColombiaComorosCongo, Dem. Rep.Congo, Rep.Costa RicaCote d'IvoireCroatiaCubaCyprusCzech RepublicDenmarkDjiboutiDominicaDominican RepublicEarly-demographic dividendEast Asia & PacificEast Asia & Pacific (excluding high income)East Asia & Pacific (IDA & IBRD countries)EcuadorEgypt, Arab Rep.El SalvadorEstoniaEthiopiaEuro areaEurope & Central AsiaEurope & Central Asia (excluding high income)Europe & Central Asia (IDA & IBRD countries)European UnionFijiFinlandFragile and conflict affected situationsFranceGabonGambia, TheGeorgiaGermanyGhanaGreeceGreenlandGrenadaGuatemalaGuineaGuinea-BissauGuyanaHaitiHeavily indebted poor countries (HIPC)High incomeHondurasHong Kong SAR, ChinaHungaryIBRD onlyIcelandIDA & IBRD totalIDA blendIDA onlyIDA totalIndiaIndonesiaIran, Islamic Rep.IraqIrelandIsraelItalyJamaicaJapanJordanKazakhstanKenyaKorea, Dem. People’s Rep.Korea, Rep.KosovoKuwaitKyrgyz RepublicLao PDRLate-demographic dividendLatin America & Caribbean Latin America & Caribbean (excluding high income)Latin America & the Caribbean (IDA & IBRD countries)LatviaLeast developed countries: UN classificationLebanonLiberiaLibyaLithuaniaLow & middle incomeLow incomeLower middle incomeLuxembourgMacao SAR, ChinaMacedonia, FYRMadagascarMalawiMalaysiaMaldivesMaliMaltaMauritaniaMauritiusMexicoMiddle East & North AfricaMiddle East & North Africa (excluding high income)Middle East & North Africa (IDA & IBRD countries)Middle incomeMoldovaMongoliaMontenegroMoroccoMozambiqueMyanmarNepalNetherlandsNew CaledoniaNew ZealandNicaraguaNigerNigeriaNorth AmericaNorwayOECD membersOmanOther small statesPacific island small statesPakistanPanamaPapua New GuineaParaguayPeruPhilippinesPolandPortugalPost-demographic dividendPre-demographic dividendQatarRomaniaRussian FederationRwandaSamoaSaudi ArabiaSenegalSerbiaSeychellesSierra LeoneSingaporeSlovak RepublicSloveniaSmall statesSomaliaSouth AfricaSouth AsiaSouth Asia (IDA & IBRD)SpainSri LankaSt. LuciaSt. Vincent and the GrenadinesSub-Saharan Africa Sub-Saharan Africa (excluding high income)Sub-Saharan Africa (IDA & IBRD countries)SudanSurinameSwedenSwitzerlandSyrian Arab RepublicTajikistanTanzaniaThailandTogoTrinidad and TobagoTunisiaTurkeyTurkmenistanUgandaUkraineUnited Arab EmiratesUnited KingdomUnited StatesUpper middle incomeUruguayUzbekistanVenezuela, RBVietnamWorldYemen, Rep.ZambiaZimbabwe Linea del tempo:
Questa scala temporale mostra un grafico dal 1963 anno al 2015 anno. Mauritania. I dati fino ad 1962 anno non disponibili. Il numero di osservazioni attuali secondo i date: 46.
La fonte (nome):
Indicatori dello sviluppo mondiale
La fonte (organizzazione):
World Bank staff estimates based data from International Monetary Fund's Direction of Trade database.
Categorie:
Private Sector, Trade
sono stati aggiornati
23 apr 2017 anni
Indicatori delle variazioni dei valori per anni
Minima:
0.0
1 gen 1963 anni
Massimo:
6.239
1 gen 1986 anni
Alla data di osservazione
Valore
Variazione assoluta
La variazione rispetto al valore precedente
1 gen 1963 anni
0.0
0.0
0.0%
1 gen 1964 anni
0.649
+0.649
%
1 gen 1965 anni
0.0
-0.649
-100.0%
1 gen 1968 anni
0.071
+0.071
%
1 gen 1969 anni
0.001
-0.069
-98.02%
1 gen 1970 anni
0.035
+0.033
2.39 Mille.%
1 gen 1971 anni
0.043
+0.009
24.74%
1 gen 1972 anni
0.0
-0.043
-100.0%
1 gen 1986 anni
6.239
+6.239
%
1 gen 1987 anni
4.098
-2.142
-34.32%
1 gen 1988 anni
2.127
-1.971
-48.1%
1 gen 1989 anni
1.281
-0.846
-39.78%
1 gen 1990 anni
0.009
-1.271
-99.27%
1 gen 1991 anni
0.317
+0.307
3.3 Mille.%
1 gen 1992 anni
0.428
+0.112
35.26%
1 gen 1993 anni
0.373
-0.055
-12.83%
1 gen 1994 anni
0.08
-0.293
-78.61%
1 gen 1995 anni
0.338
+0.258
323.65%
1 gen 1996 anni
0.503
+0.164
48.62%
1 gen 1997 anni
0.87
+0.367
73.03%
1 gen 1998 anni
0.691
-0.179
-20.57%
1 gen 1999 anni
0.624
-0.067
-9.68%
1 gen 2000 anni
1.155
+0.531
85.09%
1 gen 2001 anni
0.59
-0.564
-48.88%
1 gen 2002 anni
1.716
+1.126
190.71%
1 gen 2003 anni
2.069
+0.353
20.56%
1 gen 2004 anni
2.064
-0.005
-0.23%
1 gen 2005 anni
3.682
+1.618
78.41%
1 gen 2006 anni
3.552
-0.131
-3.55%
1 gen 2007 anni
1.565
-1.986
-55.93%
1 gen 2008 anni
3.063
+1.498
95.68%
1 gen 2009 anni
1.201
-1.862
-60.78%
1 gen 2010 anni
0.802
-0.399
-33.24%
1 gen 2011 anni
0.429
-0.372
-46.44%
1 gen 2012 anni
0.316
-0.113
-26.41%
1 gen 2013 anni
0.282
-0.034
-10.77%
1 gen 2014 anni
0.269
-0.013
-4.71%
1 gen 2015 anni
0.335
+0.066
24.64%
Classificazione dei paesi secondo i statistiche attuali per anni


Commenti: