29
/it/
it
AIzaSyAYiBZKx7MnpbEhh9jyipgxe19OcubqV5w
April 1, 2024
191582
Malta
MLT
true
2
1
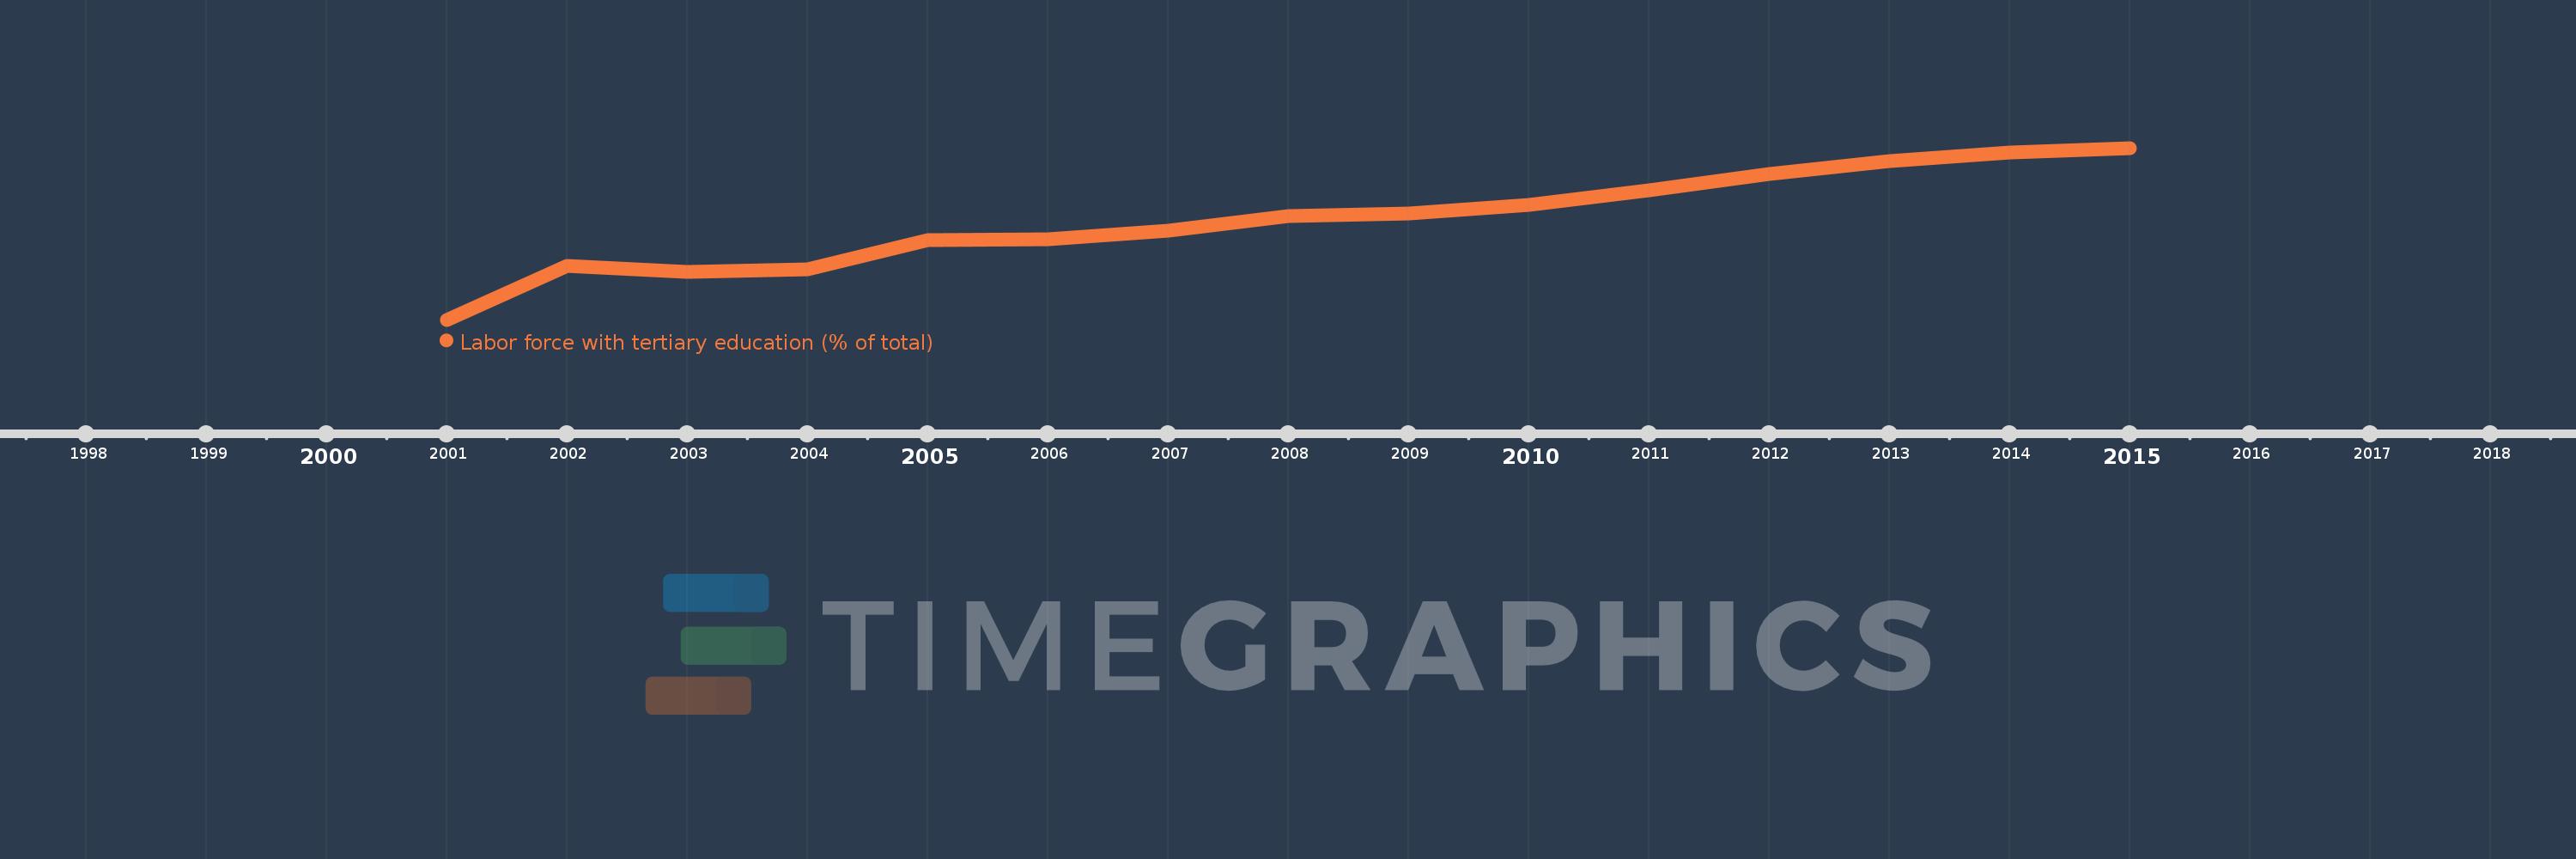
Labor force with tertiary education (% of total)
2015,2014,2013,2012,2011,2010,2009,2008,2007,2006,2005,2004,2003,2002,2001
Queste statistiche in altri paesi:
Linea del tempo:
Questa scala temporale mostra un grafico dal 2001 anno al 2015 anno. Malta. I dati fino ad 2000 anno non disponibili. Il numero di osservazioni attuali secondo i date: 15.
La fonte (nome):
Indicatori dello sviluppo mondiale
La fonte (organizzazione):
International Labour Organization, Key Indicators of the Labour Market database.
Categorie:
Education, Social Protection & Labor
sono stati aggiornati
23 apr 2017 anni
Indicatori delle variazioni dei valori per anni
Minima:
7.5
1 gen 2001 anni
Massimo:
24.1
1 gen 2015 anni
Alla data di osservazione
Valore
Variazione assoluta
La variazione rispetto al valore precedente
1 gen 2001 anni
7.5
+7.5
0.0%
1 gen 2002 anni
12.7
+5.2
69.33%
1 gen 2003 anni
12.1
-0.6
-4.72%
1 gen 2004 anni
12.4
+0.3
2.48%
1 gen 2005 anni
15.2
+2.8
22.58%
1 gen 2006 anni
15.3
+0.1
0.66%
1 gen 2007 anni
16.1
+0.8
5.23%
1 gen 2008 anni
17.5
+1.4
8.7%
1 gen 2009 anni
17.8
+0.3
1.71%
1 gen 2010 anni
18.6
+0.8
4.49%
1 gen 2011 anni
20.0
+1.4
7.53%
1 gen 2012 anni
21.6
+1.6
8.0%
1 gen 2013 anni
22.8
+1.2
5.56%
1 gen 2014 anni
23.7
+0.9
3.95%
1 gen 2015 anni
24.1
+0.4
1.69%
Classificazione dei paesi secondo i statistiche attuali per anni


Commenti: