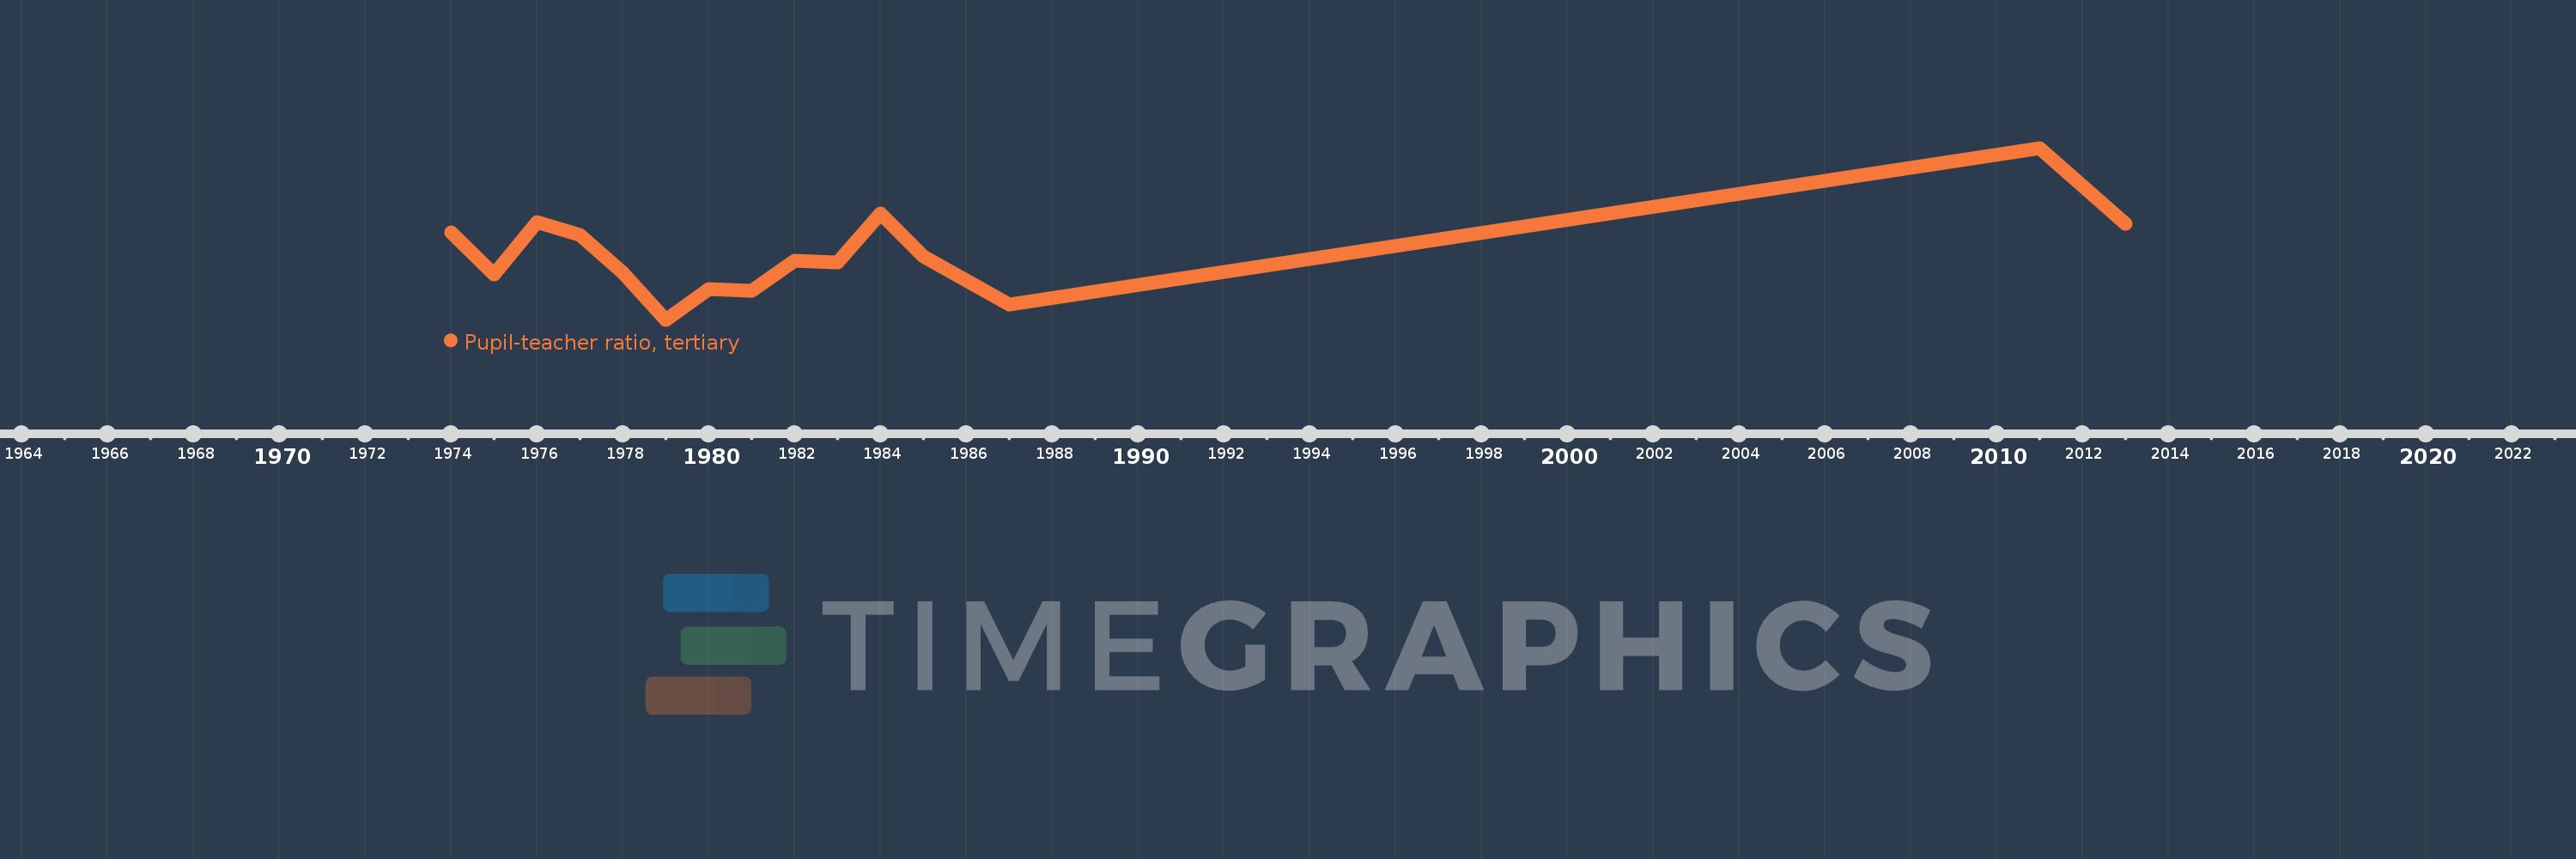
Questa scala temporale mostra un grafico dal 1974 anno al 2013 anno. Luxembourg. I dati fino ad 1973 anno non disponibili. Il numero di osservazioni attuali secondo i date: 15.
La fonte (nome):
Indicatori dello sviluppo mondiale
La fonte (organizzazione):
United Nations Educational, Scientific, and Cultural Organization (UNESCO) Institute for Statistics.
Categorie:
Education
sono stati aggiornati
23 apr 2017 anni
Indicatori delle variazioni dei valori per anni
In media:
3.141
Minima:
1.756
1 gen 1979 anni
Massimo:
5.355
1 gen 2011 anni
Alla data di osservazione
Valore
Variazione assoluta
La variazione rispetto al valore precedente
1 gen 1974 anni
3.593
+3.593
0.0%
1 gen 1975 anni
2.71
-0.883
-24.57%
1 gen 1976 anni
3.81
+1.1
40.6%
1 gen 1977 anni
3.526
-0.285
-7.47%
1 gen 1978 anni
2.736
-0.789
-22.39%
1 gen 1979 anni
1.756
-0.98
-35.83%
1 gen 1980 anni
2.405
+0.649
36.96%
1 gen 1981 anni
2.366
-0.039
-1.62%
1 gen 1982 anni
2.992
+0.626
26.47%
1 gen 1983 anni
2.962
-0.03
-1.01%
1 gen 1984 anni
3.987
+1.025
34.62%
1 gen 1985 anni
3.088
-0.899
-22.55%
1 gen 1987 anni
2.074
-1.014
-32.85%
1 gen 2011 anni
5.355
+3.281
158.21%
1 gen 2013 anni
3.758
-1.596
-29.81%
Classificazione dei paesi secondo i statistiche attuali per anni
