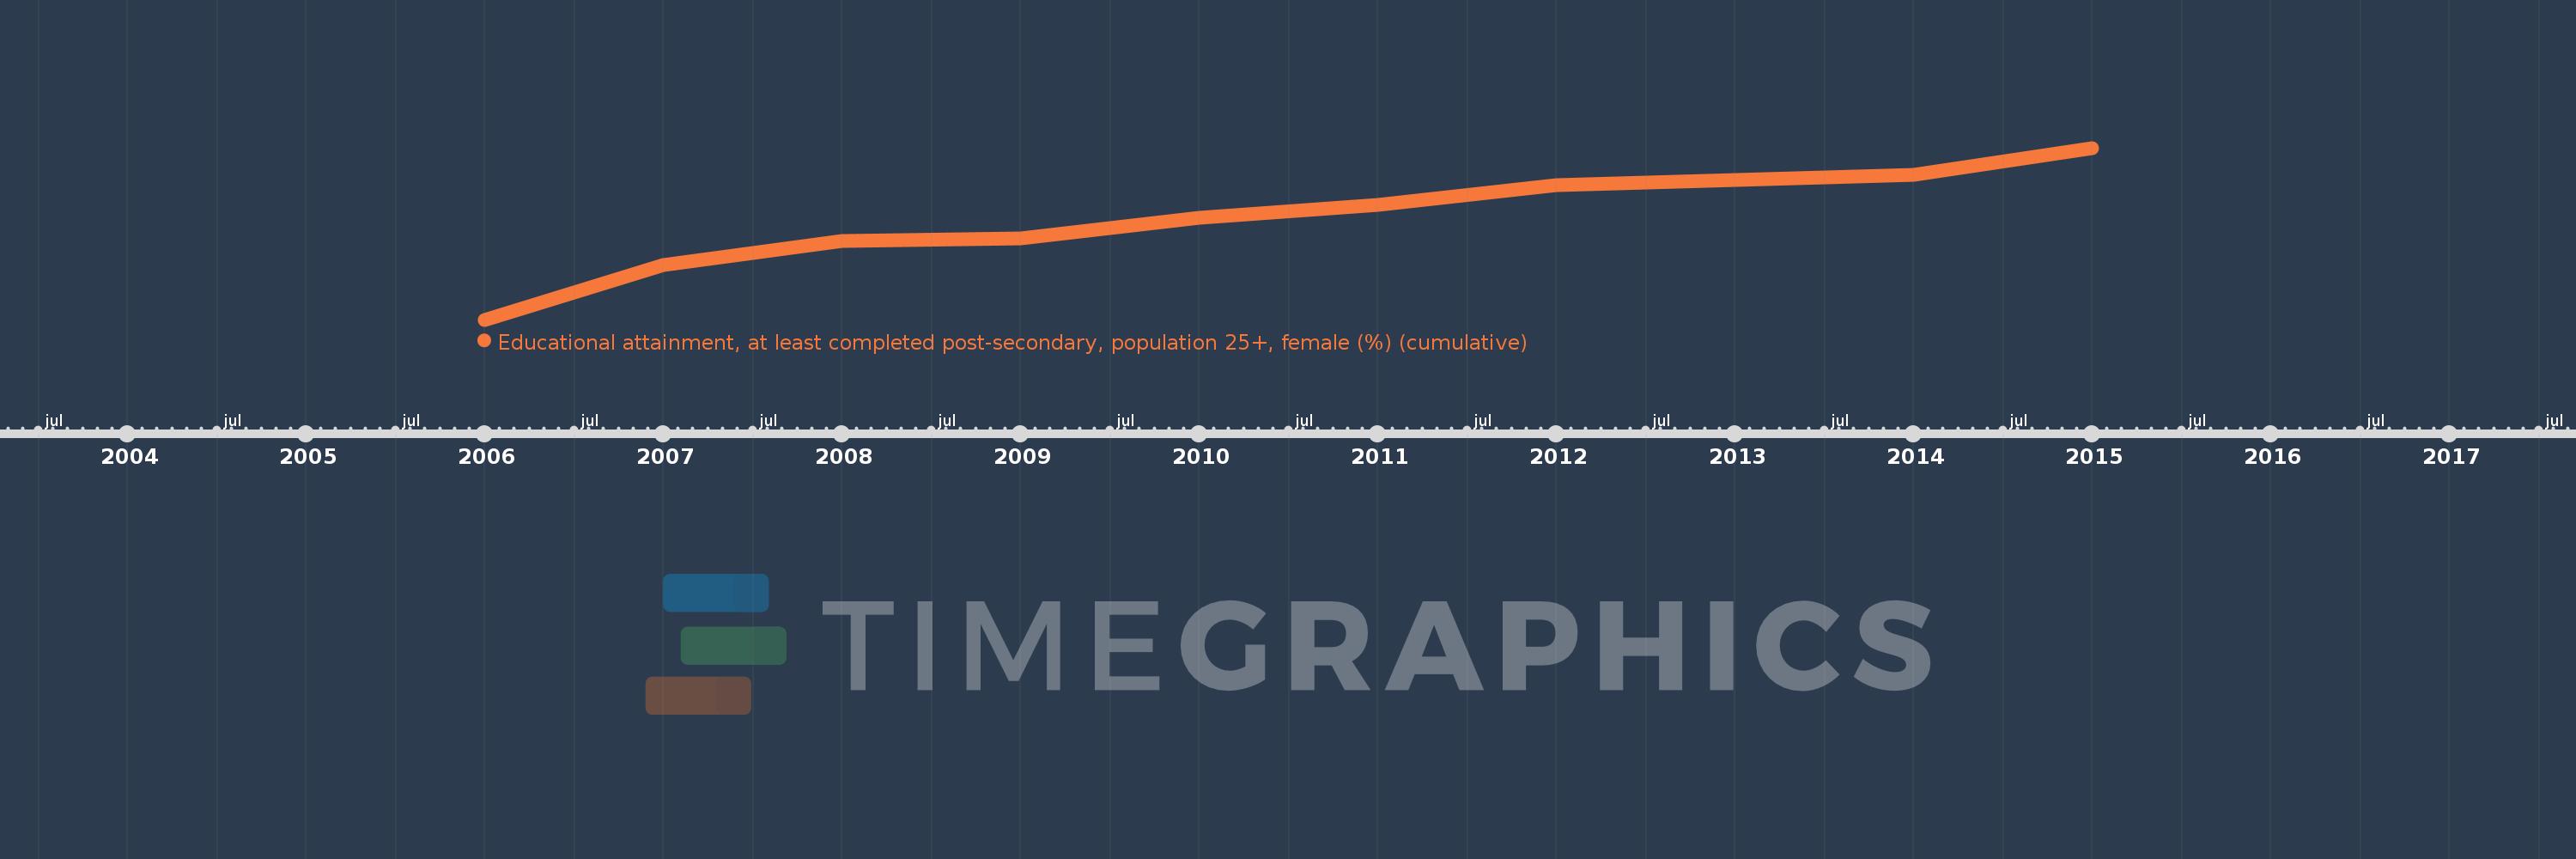
Questa scala temporale mostra un grafico dal 2006 anno al 2015 anno. Lithuania. I dati fino ad 2005 anno non disponibili. Il numero di osservazioni attuali secondo i date: 10.
La fonte (nome):
Indicatori dello sviluppo mondiale
La fonte (organizzazione):
United Nations Educational, Scientific, and Cultural Organization (UNESCO) Institute for Statistics.
Categorie:
Education, Gender
sono stati aggiornati
23 apr 2017 anni
Indicatori delle variazioni dei valori per anni
In media:
52.166
Minima:
47.415
1 gen 2006 anni
Massimo:
55.394
1 gen 2015 anni
Alla data di osservazione
Valore
Variazione assoluta
La variazione rispetto al valore precedente
1 gen 2006 anni
47.415
+47.415
0.0%
1 gen 2007 anni
49.957
+2.542
5.36%
1 gen 2008 anni
51.078
+1.12
2.24%
1 gen 2009 anni
51.183
+0.105
0.21%
1 gen 2010 anni
52.167
+0.984
1.92%
1 gen 2011 anni
52.749
+0.582
1.12%
1 gen 2012 anni
53.658
+0.91
1.72%
1 gen 2013 anni
53.9
+0.242
0.45%
1 gen 2014 anni
54.16
+0.26
0.48%
1 gen 2015 anni
55.394
+1.234
2.28%
Classificazione dei paesi secondo i statistiche attuali per anni
