29
/it/
it
AIzaSyAYiBZKx7MnpbEhh9jyipgxe19OcubqV5w
April 1, 2024
179910
Libya
LBY
true
2
1
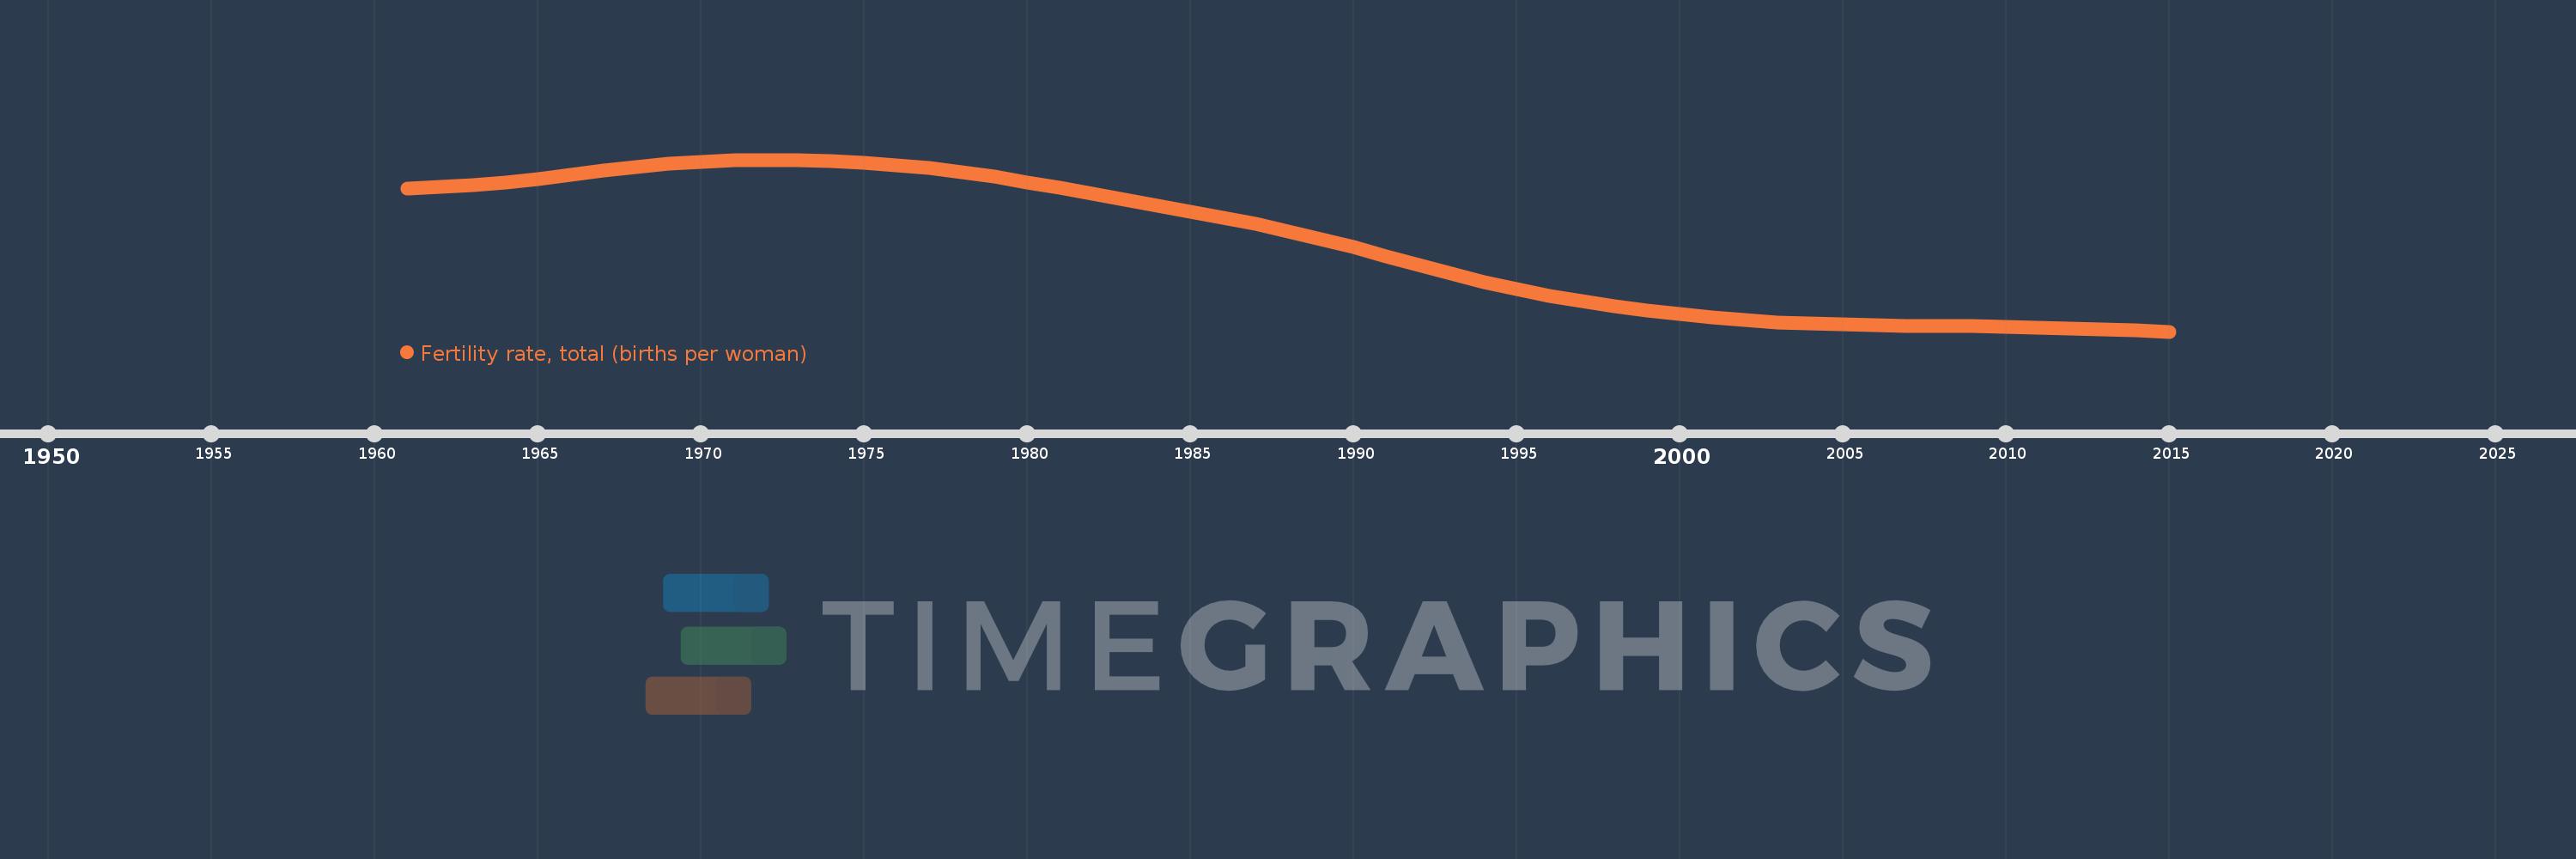
Fertility rate, total (births per woman)
2015,2014,2013,2012,2011,2010,2009,2008,2007,2006,2005,2004,2003,2002,2001,2000,1999,1998,1997,1996,1995,1994,1993,1992,1991,1990,1989,1988,1987,1986,1985,1984,1983,1982,1981,1980,1979,1978,1977,1976,1975,1974,1973,1972,1971,1970,1969,1968,1967,1966,1965,1964,1963,1962,1961
Queste statistiche in altri paesi:
AfghanistanAlbaniaAlgeriaAndorraAngolaAntigua and BarbudaArab WorldArgentinaArmeniaArubaAustraliaAustriaAzerbaijanBahamas, TheBahrainBangladeshBarbadosBelarusBelgiumBelizeBeninBermudaBhutanBoliviaBosnia and HerzegovinaBotswanaBrazilBrunei DarussalamBulgariaBurkina FasoBurundiCabo VerdeCambodiaCameroonCanadaCaribbean small statesCentral African RepublicCentral Europe and the BalticsChadChannel IslandsChileChinaColombiaComorosCongo, Dem. Rep.Congo, Rep.Costa RicaCote d'IvoireCroatiaCubaCuracaoCyprusCzech RepublicDenmarkDjiboutiDominicaDominican RepublicEarly-demographic dividendEast Asia & PacificEast Asia & Pacific (excluding high income)East Asia & Pacific (IDA & IBRD countries)EcuadorEgypt, Arab Rep.El SalvadorEquatorial GuineaEritreaEstoniaEthiopiaEuro areaEurope & Central AsiaEurope & Central Asia (excluding high income)Europe & Central Asia (IDA & IBRD countries)European UnionFaroe IslandsFijiFinlandFragile and conflict affected situationsFranceFrench PolynesiaGabonGambia, TheGeorgiaGermanyGhanaGreeceGreenlandGrenadaGuamGuatemalaGuineaGuinea-BissauGuyanaHaitiHeavily indebted poor countries (HIPC)High incomeHondurasHong Kong SAR, ChinaHungaryIBRD onlyIcelandIDA & IBRD totalIDA blendIDA onlyIDA totalIndiaIndonesiaIran, Islamic Rep.IraqIrelandIsle of ManIsraelItalyJamaicaJapanJordanKazakhstanKenyaKiribatiKorea, Dem. People’s Rep.Korea, Rep.KosovoKuwaitKyrgyz RepublicLao PDRLate-demographic dividendLatin America & Caribbean Latin America & Caribbean (excluding high income)Latin America & the Caribbean (IDA & IBRD countries)LatviaLeast developed countries: UN classificationLebanonLesothoLiberiaLibyaLiechtensteinLithuaniaLow & middle incomeLow incomeLower middle incomeLuxembourgMacao SAR, ChinaMacedonia, FYRMadagascarMalawiMalaysiaMaldivesMaliMaltaMarshall IslandsMauritaniaMauritiusMexicoMicronesia, Fed. Sts.Middle East & North AfricaMiddle East & North Africa (excluding high income)Middle East & North Africa (IDA & IBRD countries)Middle incomeMoldovaMongoliaMontenegroMoroccoMozambiqueMyanmarNamibiaNepalNetherlandsNew CaledoniaNew ZealandNicaraguaNigerNigeriaNorth AmericaNorwayOECD membersOmanOther small statesPacific island small statesPakistanPalauPanamaPapua New GuineaParaguayPeruPhilippinesPolandPortugalPost-demographic dividendPre-demographic dividendPuerto RicoQatarRomaniaRussian FederationRwandaSamoaSan MarinoSao Tome and PrincipeSaudi ArabiaSenegalSerbiaSeychellesSierra LeoneSingaporeSint Maarten (Dutch part)Slovak RepublicSloveniaSmall statesSolomon IslandsSomaliaSouth AfricaSouth AsiaSouth Asia (IDA & IBRD)South SudanSpainSri LankaSt. Kitts and NevisSt. LuciaSt. Martin (French part)St. Vincent and the GrenadinesSub-Saharan Africa Sub-Saharan Africa (excluding high income)Sub-Saharan Africa (IDA & IBRD countries)SudanSurinameSwazilandSwedenSwitzerlandSyrian Arab RepublicTajikistanTanzaniaThailandTimor-LesteTogoTongaTrinidad and TobagoTunisiaTurkeyTurkmenistanUgandaUkraineUnited Arab EmiratesUnited KingdomUnited StatesUpper middle incomeUruguayUzbekistanVanuatuVenezuela, RBVietnamVirgin Islands (U.S.)West Bank and GazaWorldYemen, Rep.ZambiaZimbabwe Linea del tempo:
Questa scala temporale mostra un grafico dal 1961 anno al 2015 anno. Libya. I dati fino ad 1960 anno non disponibili. Il numero di osservazioni attuali secondo i date: 55.
La fonte (nome):
Indicatori dello sviluppo mondiale
La fonte (organizzazione):
(1) United Nations Population Division. World Population Prospects, (2) Census reports and other statistical publications from national statistical offices, (3) Eurostat: Demographic Statistics, (4) United Nations Statistical Division. Population and Vital Statistics Reprot (various years), (5) U.S. Census Bureau: International Database, and (6) Secretariat of the Pacific Community: Statistics and Demography Programme.
Categorie:
Health, Gender
sono stati aggiornati
23 apr 2017 anni
Indicatori delle variazioni dei valori per anni
Minima:
2.467
1 gen 2015 anni
Massimo:
8.147
1 gen 1972 anni
Alla data di osservazione
Valore
Variazione assoluta
La variazione rispetto al valore precedente
1 gen 1961 anni
7.202
+7.202
0.0%
1 gen 1962 anni
7.243
+0.041
0.57%
1 gen 1963 anni
7.31
+0.067
0.93%
1 gen 1964 anni
7.402
+0.092
1.26%
1 gen 1965 anni
7.517
+0.115
1.55%
1 gen 1966 anni
7.647
+0.13
1.73%
1 gen 1967 anni
7.781
+0.134
1.75%
1 gen 1968 anni
7.905
+0.124
1.59%
1 gen 1969 anni
8.01
+0.105
1.33%
1 gen 1970 anni
8.087
+0.077
0.96%
1 gen 1971 anni
8.132
+0.045
0.56%
1 gen 1972 anni
8.147
+0.015
0.18%
1 gen 1973 anni
8.135
-0.012
-0.15%
1 gen 1974 anni
8.102
-0.033
-0.41%
1 gen 1975 anni
8.048
-0.054
-0.67%
1 gen 1976 anni
7.97
-0.078
-0.97%
1 gen 1977 anni
7.866
-0.104
-1.3%
1 gen 1978 anni
7.736
-0.13
-1.65%
1 gen 1979 anni
7.582
-0.154
-1.99%
1 gen 1980 anni
7.408
-0.174
-2.29%
1 gen 1981 anni
7.219
-0.189
-2.55%
1 gen 1982 anni
7.023
-0.196
-2.72%
1 gen 1983 anni
6.826
-0.197
-2.81%
1 gen 1984 anni
6.63
-0.196
-2.87%
1 gen 1985 anni
6.435
-0.195
-2.94%
1 gen 1986 anni
6.235
-0.2
-3.11%
1 gen 1987 anni
6.022
-0.213
-3.42%
1 gen 1988 anni
5.788
-0.234
-3.89%
1 gen 1989 anni
5.53
-0.258
-4.46%
1 gen 1990 anni
5.253
-0.277
-5.01%
1 gen 1991 anni
4.962
-0.291
-5.54%
1 gen 1992 anni
4.667
-0.295
-5.95%
1 gen 1993 anni
4.381
-0.286
-6.13%
1 gen 1994 anni
4.113
-0.268
-6.12%
1 gen 1995 anni
3.871
-0.242
-5.88%
1 gen 1996 anni
3.656
-0.215
-5.55%
1 gen 1997 anni
3.47
-0.186
-5.09%
1 gen 1998 anni
3.307
-0.163
-4.7%
1 gen 1999 anni
3.164
-0.143
-4.32%
1 gen 2000 anni
3.038
-0.126
-3.98%
1 gen 2001 anni
2.931
-0.107
-3.52%
1 gen 2002 anni
2.845
-0.086
-2.93%
1 gen 2003 anni
2.779
-0.066
-2.32%
1 gen 2004 anni
2.731
-0.048
-1.73%
1 gen 2005 anni
2.697
-0.034
-1.24%
1 gen 2006 anni
2.675
-0.022
-0.82%
1 gen 2007 anni
2.661
-0.014
-0.52%
1 gen 2008 anni
2.65
-0.011
-0.41%
1 gen 2009 anni
2.638
-0.012
-0.45%
1 gen 2010 anni
2.624
-0.014
-0.53%
1 gen 2011 anni
2.603
-0.021
-0.8%
1 gen 2012 anni
2.576
-0.027
-1.04%
1 gen 2013 anni
2.543
-0.033
-1.28%
1 gen 2014 anni
2.507
-0.036
-1.42%
1 gen 2015 anni
2.467
-0.04
-1.6%
Classificazione dei paesi secondo i statistiche attuali per anni


Commenti: