29
/it/
it
AIzaSyAYiBZKx7MnpbEhh9jyipgxe19OcubqV5w
April 1, 2024
179189
Liberia
LBR
true
2
1
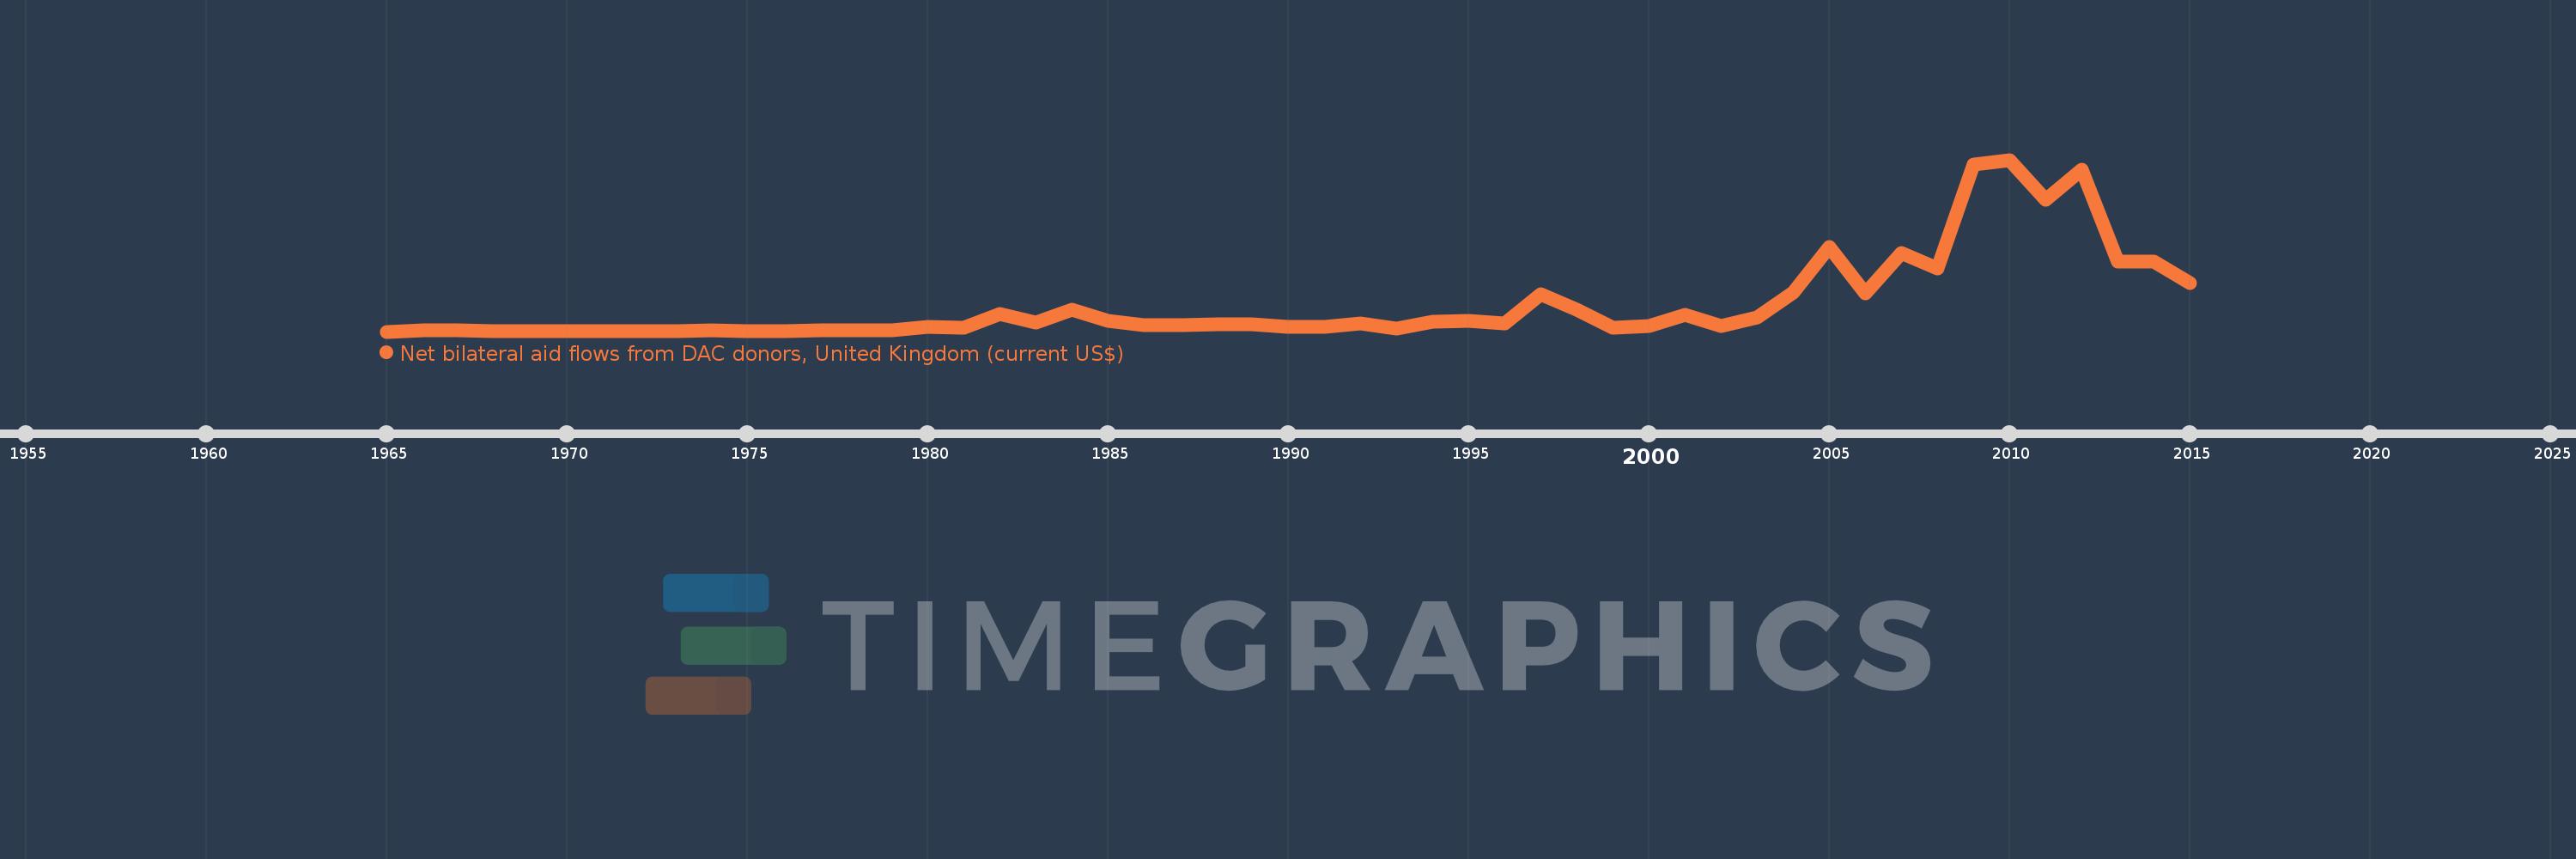
Net bilateral aid flows from DAC donors, United Kingdom (current US$)
2015,2014,2013,2012,2011,2010,2009,2008,2007,2006,2005,2004,2003,2002,2001,2000,1999,1998,1997,1996,1995,1994,1993,1992,1991,1990,1989,1988,1987,1986,1985,1984,1983,1982,1981,1980,1979,1978,1977,1976,1975,1974,1973,1972,1971,1970,1969,1968,1967,1966,1965
Queste statistiche in altri paesi:
AfghanistanAlbaniaAlgeriaAngolaAntigua and BarbudaArab WorldArgentinaArmeniaArubaAzerbaijanBahamas, TheBahrainBangladeshBarbadosBelarusBelizeBeninBermudaBhutanBoliviaBosnia and HerzegovinaBotswanaBrazilBritish Virgin IslandsBrunei DarussalamBulgariaBurkina FasoBurundiCabo VerdeCambodiaCameroonCaribbean small statesCayman IslandsCentral African RepublicCentral Europe and the BalticsChadChileChinaColombiaComorosCongo, Dem. Rep.Congo, Rep.Costa RicaCote d'IvoireCroatiaCubaCyprusCzech RepublicDjiboutiDominicaDominican RepublicEast Asia & PacificEast Asia & Pacific (excluding high income)East Asia & Pacific (IDA & IBRD countries)EcuadorEgypt, Arab Rep.El SalvadorEquatorial GuineaEritreaEstoniaEthiopiaEuro areaEurope & Central AsiaEurope & Central Asia (excluding high income)Europe & Central Asia (IDA & IBRD countries)European UnionFijiFragile and conflict affected situationsFrench PolynesiaGabonGambia, TheGeorgiaGhanaGibraltarGrenadaGuatemalaGuineaGuinea-BissauGuyanaHaitiHeavily indebted poor countries (HIPC)High incomeHondurasHong Kong SAR, ChinaHungaryIBRD onlyIDA & IBRD totalIDA blendIDA onlyIDA totalIndiaIndonesiaIran, Islamic Rep.IraqIsraelJamaicaJordanKazakhstanKenyaKiribatiKorea, Dem. People’s Rep.Korea, Rep.KosovoKyrgyz RepublicLao PDRLatin America & Caribbean Latin America & Caribbean (excluding high income)Latin America & the Caribbean (IDA & IBRD countries)LatviaLeast developed countries: UN classificationLebanonLesothoLiberiaLibyaLithuaniaLow & middle incomeLow incomeLower middle incomeMacedonia, FYRMadagascarMalawiMalaysiaMaldivesMaliMaltaMarshall IslandsMauritaniaMauritiusMexicoMiddle East & North AfricaMiddle East & North Africa (excluding high income)Middle East & North Africa (IDA & IBRD countries)Middle incomeMoldovaMongoliaMontenegroMoroccoMozambiqueMyanmarNamibiaNauruNepalNew CaledoniaNicaraguaNigerNigeriaNorth AmericaOECD membersOmanOther small statesPacific island small statesPakistanPalauPanamaPapua New GuineaParaguayPeruPhilippinesPolandQatarRomaniaRussian FederationRwandaSamoaSao Tome and PrincipeSaudi ArabiaSenegalSerbiaSeychellesSierra LeoneSingaporeSlovak RepublicSloveniaSmall statesSolomon IslandsSomaliaSouth AfricaSouth AsiaSouth Asia (IDA & IBRD)South SudanSri LankaSt. Kitts and NevisSt. LuciaSt. Vincent and the GrenadinesSub-Saharan Africa Sub-Saharan Africa (excluding high income)Sub-Saharan Africa (IDA & IBRD countries)SudanSurinameSwazilandSyrian Arab RepublicTajikistanTanzaniaThailandTimor-LesteTogoTongaTrinidad and TobagoTunisiaTurkeyTurkmenistanTurks and Caicos IslandsTuvaluUgandaUkraineUnited Arab EmiratesUpper middle incomeUruguayUzbekistanVanuatuVenezuela, RBVietnamWest Bank and GazaWorldYemen, Rep.ZambiaZimbabwe Linea del tempo:
Questa scala temporale mostra un grafico dal 1965 anno al 2015 anno. Liberia. I dati fino ad 1964 anno non disponibili. Il numero di osservazioni attuali secondo i date: 51.
La fonte (nome):
Indicatori dello sviluppo mondiale
La fonte (organizzazione):
Development Assistance Committee of the Organisation for Economic Co-operation and Development, Geographical Distribution of Financial Flows to Developing Countries, Development Co-operation Report, and International Development Statistics database. Data are available online at: www.oecd.org/dac/stats/idsonline.
Categorie:
Aid Effectiveness
sono stati aggiornati
23 apr 2017 anni
Indicatori delle variazioni dei valori per anni
Minima:
40.0 Mille.
1 gen 1965 anni
Massimo:
33.4 Mln
1 gen 2010 anni
Alla data di osservazione
Valore
Variazione assoluta
La variazione rispetto al valore precedente
1 gen 1965 anni
40.0 Mille.
+40.0 Mille.
0.0%
1 gen 1966 anni
360.0 Mille.
+320.0 Mille.
800.0%
1 gen 1967 anni
290.0 Mille.
-70.0 Mille.
-19.44%
1 gen 1968 anni
120.0 Mille.
-170.0 Mille.
-58.62%
1 gen 1969 anni
70.0 Mille.
-50.0 Mille.
-41.67%
1 gen 1970 anni
110.0 Mille.
+40.0 Mille.
57.14%
1 gen 1971 anni
70.0 Mille.
-40.0 Mille.
-36.36%
1 gen 1972 anni
110.0 Mille.
+40.0 Mille.
57.14%
1 gen 1973 anni
90.0 Mille.
-20.0 Mille.
-18.18%
1 gen 1974 anni
230.0 Mille.
+140.0 Mille.
155.56%
1 gen 1975 anni
90.0 Mille.
-140.0 Mille.
-60.87%
1 gen 1976 anni
150.0 Mille.
+60.0 Mille.
66.67%
1 gen 1977 anni
350.0 Mille.
+200.0 Mille.
133.33%
1 gen 1978 anni
320.0 Mille.
-30.0 Mille.
-8.57%
1 gen 1979 anni
310.0 Mille.
-10.0 Mille.
-3.13%
1 gen 1980 anni
970.0 Mille.
+660.0 Mille.
212.9%
1 gen 1981 anni
750.0 Mille.
-220.0 Mille.
-22.68%
1 gen 1982 anni
3.46 Mln
+2.71 Mln
361.33%
1 gen 1983 anni
1.71 Mln
-1.75 Mln
-50.58%
1 gen 1984 anni
4.33 Mln
+2.62 Mln
153.22%
1 gen 1985 anni
2.05 Mln
-2.28 Mln
-52.66%
1 gen 1986 anni
1.26 Mln
-790.0 Mille.
-38.54%
1 gen 1987 anni
1.33 Mln
+70.0 Mille.
5.56%
1 gen 1988 anni
1.5 Mln
+170.0 Mille.
12.78%
1 gen 1989 anni
1.53 Mln
+30.0 Mille.
2.0%
1 gen 1990 anni
1.01 Mln
-520.0 Mille.
-33.99%
1 gen 1991 anni
1.01 Mln
0.0
0.0%
1 gen 1992 anni
1.63 Mln
+620.0 Mille.
61.39%
1 gen 1993 anni
620.0 Mille.
-1.01 Mln
-61.96%
1 gen 1994 anni
1.89 Mln
+1.27 Mln
204.84%
1 gen 1995 anni
2.07 Mln
+180.0 Mille.
9.52%
1 gen 1996 anni
1.7 Mln
-370.0 Mille.
-17.87%
1 gen 1997 anni
7.22 Mln
+5.52 Mln
324.71%
1 gen 1998 anni
4.26 Mln
-2.96 Mln
-41.0%
1 gen 1999 anni
780.0 Mille.
-3.48 Mln
-81.69%
1 gen 2000 anni
1.08 Mln
+300.0 Mille.
38.46%
1 gen 2001 anni
3.28 Mln
+2.2 Mln
203.7%
1 gen 2002 anni
1.17 Mln
-2.11 Mln
-64.33%
1 gen 2003 anni
2.85 Mln
+1.68 Mln
143.59%
1 gen 2004 anni
7.63 Mln
+4.78 Mln
167.72%
1 gen 2005 anni
16.46 Mln
+8.83 Mln
115.73%
1 gen 2006 anni
7.54 Mln
-8.92 Mln
-54.19%
1 gen 2007 anni
15.27 Mln
+7.73 Mln
102.52%
1 gen 2008 anni
12.36 Mln
-2.91 Mln
-19.06%
1 gen 2009 anni
32.4 Mln
+20.04 Mln
162.14%
1 gen 2010 anni
33.4 Mln
+1000.0 Mille.
3.09%
1 gen 2011 anni
25.58 Mln
-7.82 Mln
-23.41%
1 gen 2012 anni
31.51 Mln
+5.93 Mln
23.18%
1 gen 2013 anni
13.66 Mln
-17.85 Mln
-56.65%
1 gen 2014 anni
13.64 Mln
-20.0 Mille.
-0.15%
1 gen 2015 anni
9.54 Mln
-4.1 Mln
-30.06%
Classificazione dei paesi secondo i statistiche attuali per anni


Commenti: