29
/it/
it
AIzaSyAYiBZKx7MnpbEhh9jyipgxe19OcubqV5w
April 1, 2024
178859
Liberia
LBR
true
2
1
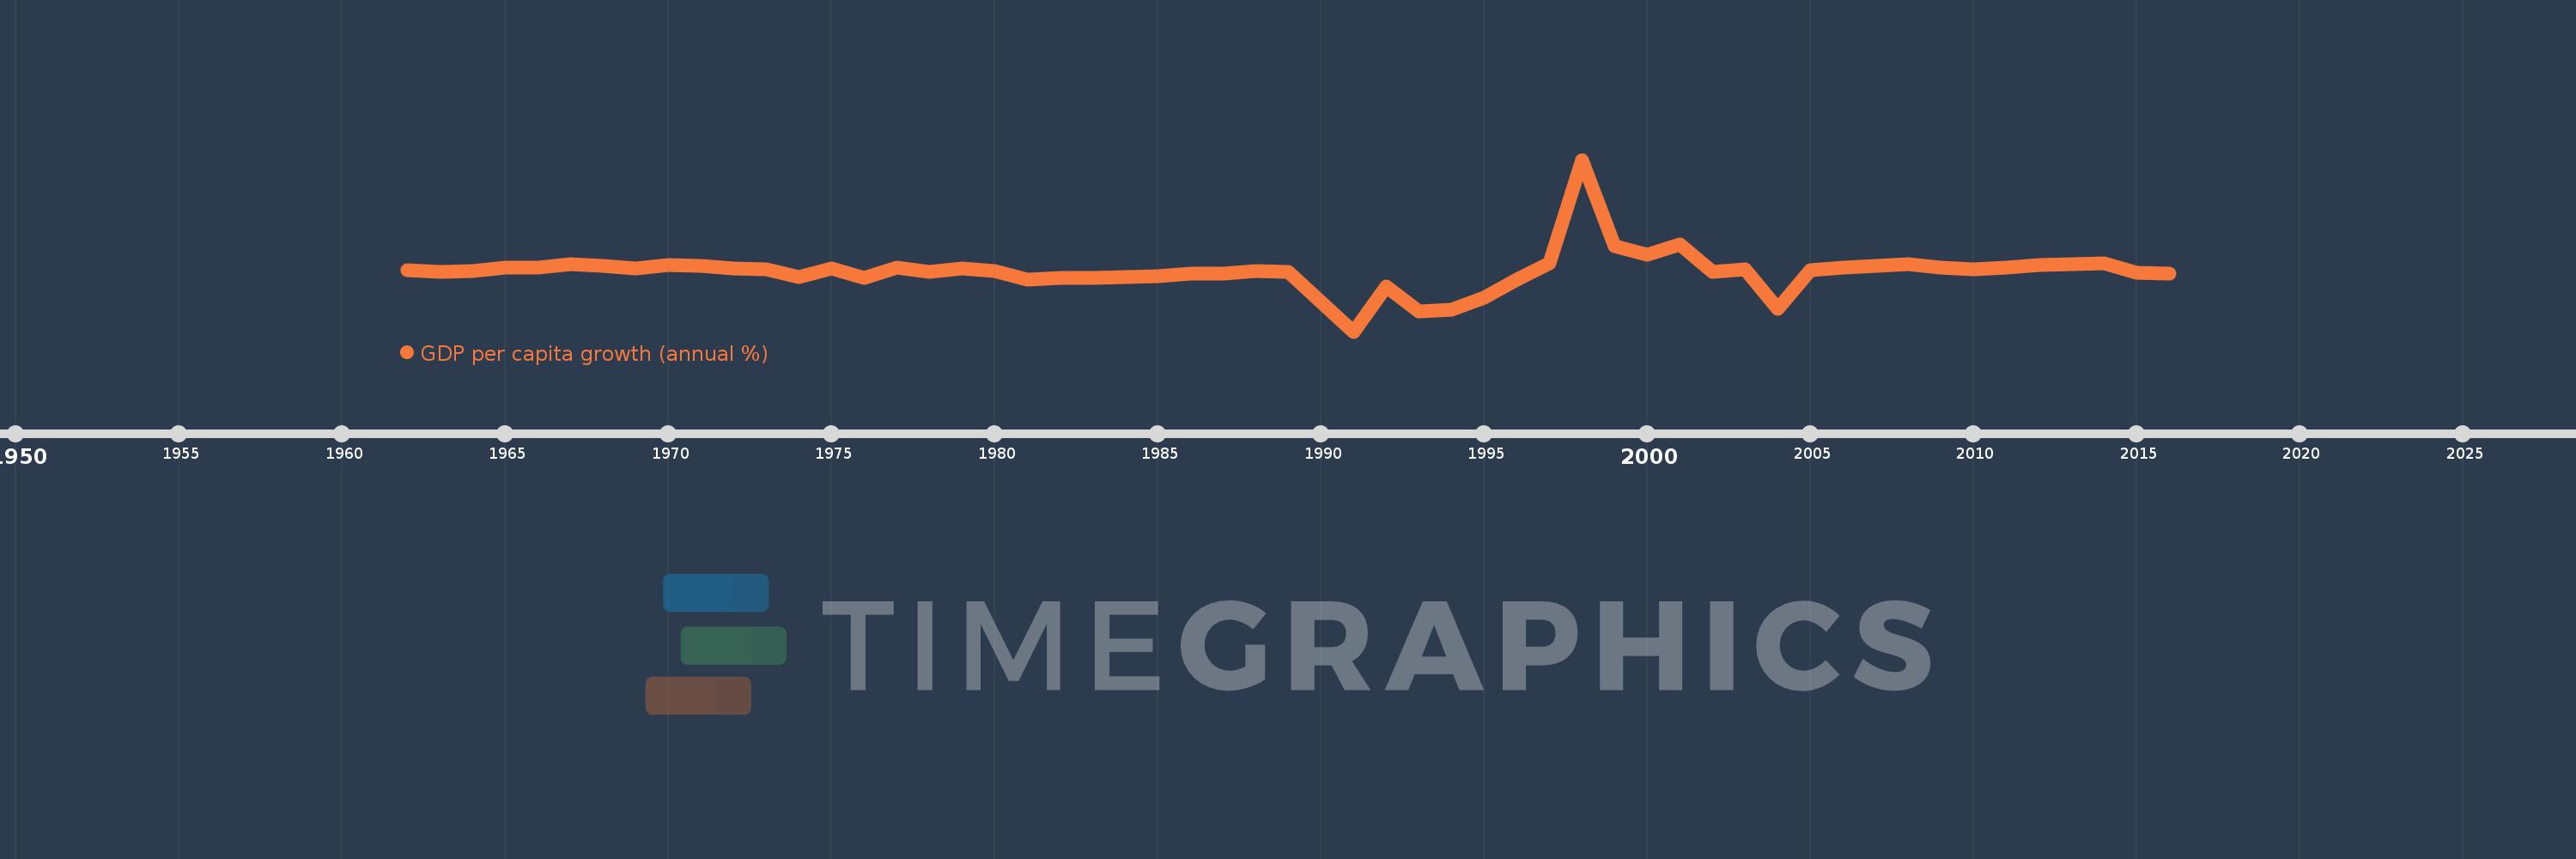
GDP per capita growth (annual %)
2016,2015,2014,2013,2012,2011,2010,2009,2008,2007,2006,2005,2004,2003,2002,2001,2000,1999,1998,1997,1996,1995,1994,1993,1992,1991,1990,1989,1988,1987,1986,1985,1984,1983,1982,1981,1980,1979,1978,1977,1976,1975,1974,1973,1972,1971,1970,1969,1968,1967,1966,1965,1964,1963,1962
Queste statistiche in altri paesi:
AfghanistanAlbaniaAlgeriaAndorraAngolaAntigua and BarbudaArab WorldArgentinaArmeniaArubaAustraliaAustriaAzerbaijanBahamas, TheBahrainBangladeshBarbadosBelarusBelgiumBelizeBeninBermudaBhutanBoliviaBosnia and HerzegovinaBotswanaBrazilBrunei DarussalamBulgariaBurkina FasoBurundiCabo VerdeCambodiaCameroonCanadaCaribbean small statesCayman IslandsCentral African RepublicCentral Europe and the BalticsChadChannel IslandsChileChinaColombiaComorosCongo, Dem. Rep.Congo, Rep.Costa RicaCote d'IvoireCroatiaCubaCyprusCzech RepublicDenmarkDjiboutiDominicaDominican RepublicEarly-demographic dividendEast Asia & PacificEast Asia & Pacific (excluding high income)East Asia & Pacific (IDA & IBRD countries)EcuadorEgypt, Arab Rep.El SalvadorEquatorial GuineaEritreaEstoniaEthiopiaEuro areaEurope & Central AsiaEurope & Central Asia (excluding high income)Europe & Central Asia (IDA & IBRD countries)European UnionFijiFinlandFragile and conflict affected situationsFranceFrench PolynesiaGabonGambia, TheGeorgiaGermanyGhanaGreeceGreenlandGrenadaGuatemalaGuineaGuinea-BissauGuyanaHaitiHeavily indebted poor countries (HIPC)High incomeHondurasHong Kong SAR, ChinaHungaryIBRD onlyIcelandIDA & IBRD totalIDA blendIDA onlyIDA totalIndiaIndonesiaIran, Islamic Rep.IraqIrelandIsle of ManIsraelItalyJamaicaJapanJordanKazakhstanKenyaKiribatiKorea, Rep.KosovoKuwaitKyrgyz RepublicLao PDRLate-demographic dividendLatin America & Caribbean Latin America & Caribbean (excluding high income)Latin America & the Caribbean (IDA & IBRD countries)LatviaLeast developed countries: UN classificationLebanonLesothoLiberiaLibyaLiechtensteinLithuaniaLow & middle incomeLow incomeLower middle incomeLuxembourgMacao SAR, ChinaMacedonia, FYRMadagascarMalawiMalaysiaMaldivesMaliMaltaMarshall IslandsMauritaniaMauritiusMexicoMicronesia, Fed. Sts.Middle East & North AfricaMiddle East & North Africa (excluding high income)Middle East & North Africa (IDA & IBRD countries)Middle incomeMoldovaMonacoMongoliaMontenegroMoroccoMozambiqueMyanmarNamibiaNauruNepalNetherlandsNew CaledoniaNew ZealandNicaraguaNigerNigeriaNorth AmericaNorwayOECD membersOmanOther small statesPacific island small statesPakistanPalauPanamaPapua New GuineaParaguayPeruPhilippinesPolandPortugalPost-demographic dividendPre-demographic dividendPuerto RicoQatarRomaniaRussian FederationRwandaSamoaSan MarinoSao Tome and PrincipeSaudi ArabiaSenegalSerbiaSeychellesSierra LeoneSingaporeSlovak RepublicSloveniaSmall statesSolomon IslandsSomaliaSouth AfricaSouth AsiaSouth Asia (IDA & IBRD)South SudanSpainSri LankaSt. Kitts and NevisSt. LuciaSt. Vincent and the GrenadinesSub-Saharan Africa Sub-Saharan Africa (excluding high income)Sub-Saharan Africa (IDA & IBRD countries)SudanSurinameSwazilandSwedenSwitzerlandSyrian Arab RepublicTajikistanTanzaniaThailandTimor-LesteTogoTongaTrinidad and TobagoTunisiaTurkeyTurkmenistanTuvaluUgandaUkraineUnited Arab EmiratesUnited KingdomUnited StatesUpper middle incomeUruguayUzbekistanVanuatuVenezuela, RBVietnamVirgin Islands (U.S.)West Bank and GazaWorldYemen, Rep.ZambiaZimbabwe Linea del tempo:
Questa scala temporale mostra un grafico dal 1962 anno al 2016 anno. Liberia. I dati fino ad 1961 anno non disponibili. Il numero di osservazioni attuali secondo i date: 55.
La fonte (nome):
Indicatori dello sviluppo mondiale
La fonte (organizzazione):
World Bank national accounts data, and OECD National Accounts data files.
Categorie:
Economy & Growth
sono stati aggiornati
23 apr 2017 anni
Indicatori delle variazioni dei valori per anni
Minima:
-50.236
1 gen 1991 anni
Massimo:
91.673
1 gen 1998 anni
Alla data di osservazione
Valore
Variazione assoluta
La variazione rispetto al valore precedente
1 gen 1962 anni
0.241
+0.241
0.0%
1 gen 1963 anni
-0.853
-1.093
-454.47%
1 gen 1964 anni
0.025
+0.877
-102.9%
1 gen 1965 anni
2.789
+2.764
11.17 Mille.%
1 gen 1966 anni
2.379
-0.41
-14.71%
1 gen 1967 anni
5.157
+2.778
116.77%
1 gen 1968 anni
4.163
-0.993
-19.26%
1 gen 1969 anni
2.179
-1.984
-47.65%
1 gen 1970 anni
4.585
+2.406
110.38%
1 gen 1971 anni
3.927
-0.658
-14.36%
1 gen 1972 anni
2.171
-1.756
-44.71%
1 gen 1973 anni
1.383
-0.788
-36.28%
1 gen 1974 anni
-4.894
-6.277
-453.73%
1 gen 1975 anni
1.861
+6.754
-138.02%
1 gen 1976 anni
-6.199
-8.06
-433.2%
1 gen 1977 anni
2.335
+8.534
-137.66%
1 gen 1978 anni
-1.257
-3.592
-153.85%
1 gen 1979 anni
1.812
+3.069
-244.07%
1 gen 1980 anni
0.12
-1.692
-93.39%
1 gen 1981 anni
-7.218
-7.338
-6.12 Mille.%
1 gen 1982 anni
-5.592
+1.626
-22.53%
1 gen 1983 anni
-6.004
-0.412
7.37%
1 gen 1984 anni
-5.211
+0.793
-13.21%
1 gen 1985 anni
-4.655
+0.556
-10.67%
1 gen 1986 anni
-2.36
+2.295
-49.31%
1 gen 1987 anni
-2.099
+0.261
-11.07%
1 gen 1988 anni
-0.521
+1.578
-75.18%
1 gen 1989 anni
-0.878
-0.358
68.63%
1 gen 1990 anni
-25.522
-24.644
2.81 Mille.%
1 gen 1991 anni
-50.236
-24.714
96.83%
1 gen 1992 anni
-12.697
+37.539
-74.73%
1 gen 1993 anni
-33.889
-21.193
166.91%
1 gen 1994 anni
-32.23
+1.66
-4.9%
1 gen 1995 anni
-22.258
+9.971
-30.94%
1 gen 1996 anni
-7.063
+15.195
-68.27%
1 gen 1997 anni
6.108
+13.171
-186.47%
1 gen 1998 anni
91.673
+85.565
1.4 Mille.%
1 gen 1999 anni
20.395
-71.278
-77.75%
1 gen 2000 anni
13.586
-6.809
-33.38%
1 gen 2001 anni
21.935
+8.349
61.46%
1 gen 2002 anni
-0.747
-22.682
-103.4%
1 gen 2003 anni
1.333
+2.08
-278.51%
1 gen 2004 anni
-31.343
-32.676
-2.45 Mille.%
1 gen 2005 anni
0.674
+32.016
-102.15%
1 gen 2006 anni
2.541
+1.867
277.14%
1 gen 2007 anni
4.372
+1.831
72.08%
1 gen 2008 anni
5.258
+0.886
20.27%
1 gen 2009 anni
2.758
-2.5
-47.55%
1 gen 2010 anni
1.202
-1.556
-56.41%
1 gen 2011 anni
2.441
+1.239
103.04%
1 gen 2012 anni
4.975
+2.534
103.82%
1 gen 2013 anni
5.144
+0.169
3.4%
1 gen 2014 anni
6.083
+0.938
18.24%
1 gen 2015 anni
-1.655
-7.737
-127.21%
1 gen 2016 anni
-2.373
-0.719
43.42%
Classificazione dei paesi secondo i statistiche attuali per anni


Commenti: