30
/it/
AIzaSyAYiBZKx7MnpbEhh9jyipgxe19OcubqV5w
April 1, 2024
177998
Lesotho
LSO
true
2
1
Net intake rate in grade 1, male (% of official school-age population)
2015,2014,2013,2012,2011,2010,2009,2008,2007,2006,2005,2004,2003,2002,2001,2000,1999
Download
Biblioteca di statistiche globali →Lesotho →

Net intake rate in grade 1, male (% of official school-age population)

Queste statistiche in altri paesi:

AfghanistanAlbaniaAlgeriaAngolaAntigua and BarbudaArab WorldArmeniaArubaAzerbaijanBahamas, TheBahrainBangladeshBarbadosBelarusBelizeBeninBermudaBhutanBoliviaBosnia and HerzegovinaBotswanaBrunei DarussalamBulgariaBurkina FasoBurundiCabo VerdeCambodiaCameroonCaribbean small statesCentral African RepublicChadChileColombiaComorosCongo, Dem. Rep.Congo, Rep.Costa RicaCote d'IvoireCroatiaCubaCyprusDenmarkDjiboutiDominicaDominican RepublicEarly-demographic dividendEcuadorEgypt, Arab Rep.El SalvadorEquatorial GuineaEritreaEstoniaEthiopiaEuro areaEurope & Central AsiaEurope & Central Asia (excluding high income)Europe & Central Asia (IDA & IBRD countries)FijiFragile and conflict affected situationsGambia, TheGeorgiaGhanaGreeceGrenadaGuatemalaGuineaGuinea-BissauGuyanaHeavily indebted poor countries (HIPC)High incomeHondurasIcelandIDA & IBRD totalIDA onlyIDA totalIndonesiaIran, Islamic Rep.IraqIrelandItalyJapanJordanKazakhstanKenyaKorea, Dem. People’s Rep.Korea, Rep.KuwaitKyrgyz RepublicLao PDRLatin America & Caribbean Latin America & Caribbean (excluding high income)Latin America & the Caribbean (IDA & IBRD countries)Least developed countries: UN classificationLebanonLesothoLiberiaLiechtensteinLithuaniaLow & middle incomeLow incomeLuxembourgMacedonia, FYRMadagascarMalawiMaldivesMaliMaltaMarshall IslandsMauritaniaMauritiusMexicoMicronesia, Fed. Sts.Middle East & North AfricaMiddle East & North Africa (excluding high income)Middle East & North Africa (IDA & IBRD countries)MoldovaMongoliaMontenegroMoroccoMozambiqueNamibiaNauruNepalNicaraguaNigerNorth AmericaNorwayOECD membersOmanOther small statesPacific island small statesParaguayPeruPhilippinesPortugalPost-demographic dividendPre-demographic dividendPuerto RicoQatarRomaniaRwandaSamoaSan MarinoSao Tome and PrincipeSaudi ArabiaSenegalSerbiaSeychellesSierra LeoneSloveniaSmall statesSolomon IslandsSouth AfricaSpainSri LankaSt. Kitts and NevisSt. LuciaSt. Vincent and the GrenadinesSub-Saharan Africa Sub-Saharan Africa (excluding high income)Sub-Saharan Africa (IDA & IBRD countries)SurinameSwazilandSwedenSwitzerlandSyrian Arab RepublicTajikistanTanzaniaThailandTimor-LesteTogoTongaTrinidad and TobagoTunisiaTurkeyUgandaUkraineUnited Arab EmiratesUnited StatesUruguayUzbekistanVanuatuVenezuela, RBWest Bank and GazaWorldYemen, Rep.ZambiaZimbabwe

Linea del tempo:

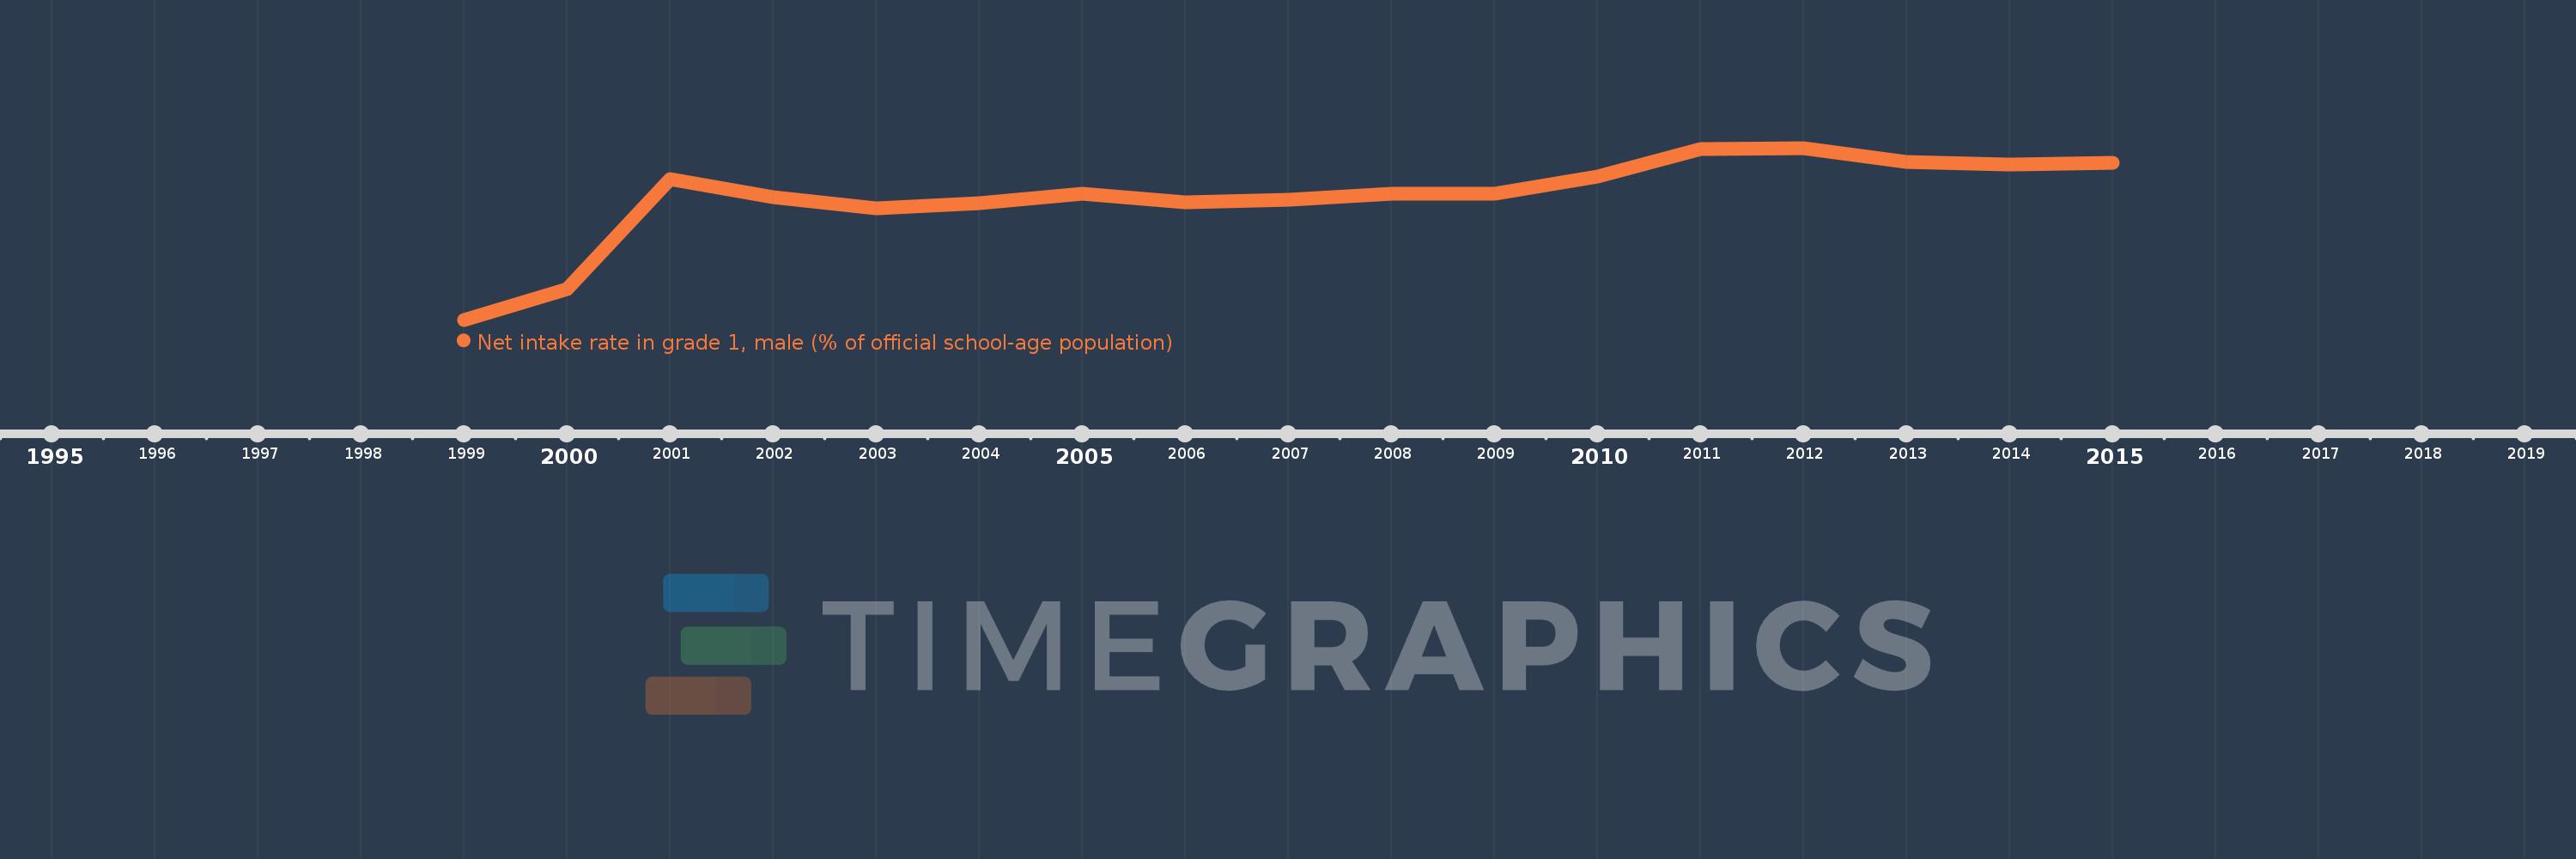
Questa scala temporale mostra un grafico dal 1999 anno al 2015 anno. Lesotho. I dati fino ad 1998 anno non disponibili. Il numero di osservazioni attuali secondo i date: 17.

La fonte (nome):

Indicatori dello sviluppo mondiale

La fonte (organizzazione):

United Nations Educational, Scientific, and Cultural Organization (UNESCO) Institute for Statistics.

Categorie:

Education, Gender

sono stati aggiornati

23 apr 2017 anni

Indicatori delle variazioni dei valori per anni

In media:
50.944
Minima:
17.194
1 gen 1999 anni
Massimo:
64.295
1 gen 2012 anni
Alla data di osservazione
Valore
Variazione assoluta
La variazione rispetto al valore precedente
1 gen 1999 anni
17.194
+17.194
0.0%
1 gen 2000 anni
25.559
+8.365
48.65%
1 gen 2001 anni
55.747
+30.188
118.11%
1 gen 2002 anni
50.819
-4.928
-8.84%
1 gen 2003 anni
47.813
-3.006
-5.92%
1 gen 2004 anni
49.065
+1.252
2.62%
1 gen 2005 anni
51.73
+2.666
5.43%
1 gen 2006 anni
49.395
-2.335
-4.51%
1 gen 2007 anni
50.106
+0.711
1.44%
1 gen 2008 anni
51.715
+1.609
3.21%
1 gen 2009 anni
51.717
+0.003
0.01%
1 gen 2010 anni
56.439
+4.721
9.13%
1 gen 2011 anni
63.923
+7.484
13.26%
1 gen 2012 anni
64.295
+0.372
0.58%
1 gen 2013 anni
60.474
-3.821
-5.94%
1 gen 2014 anni
59.836
-0.638
-1.06%
1 gen 2015 anni
60.223
+0.388
0.65%

Classificazione dei paesi secondo i statistiche attuali per anni