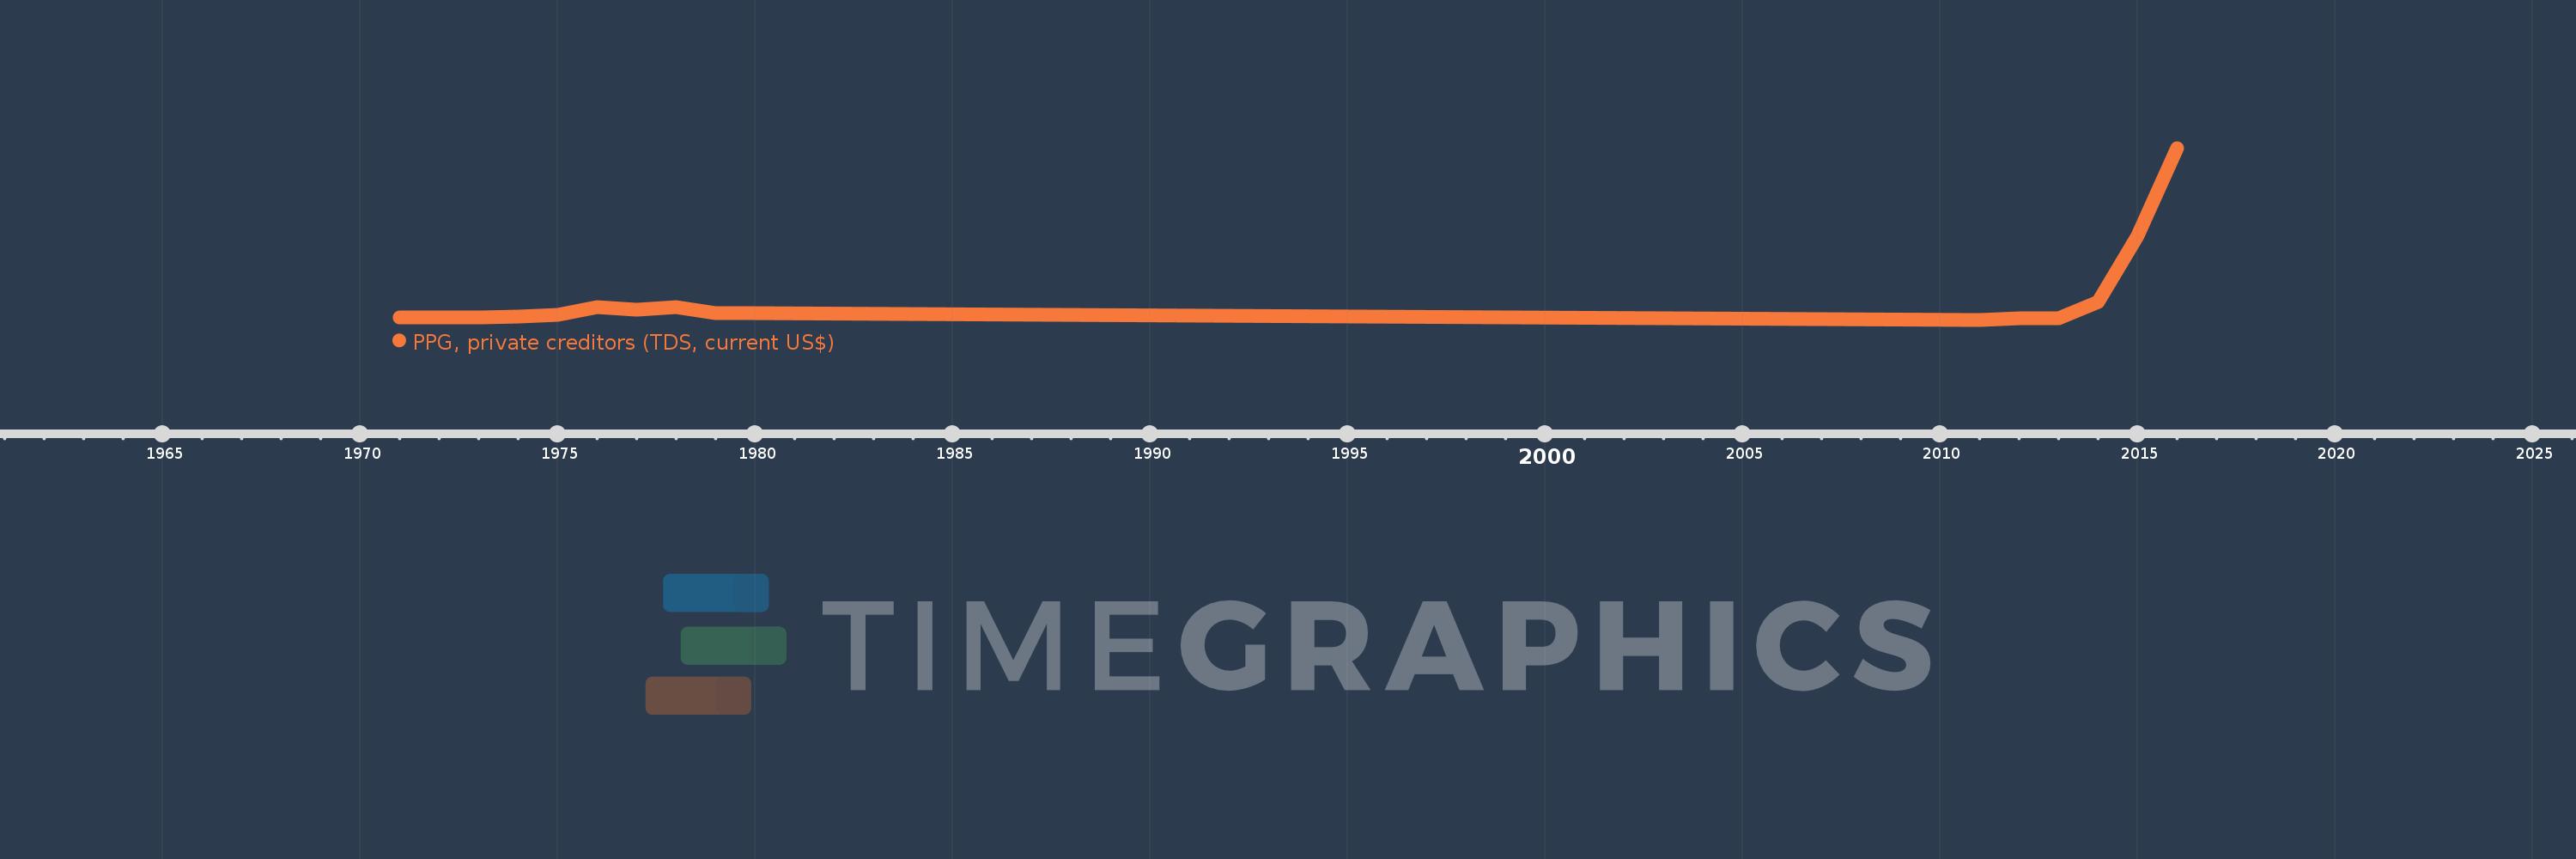
Questa scala temporale mostra un grafico dal 1971 anno al 2016 anno. Lao PDR. I dati fino ad 1970 anno non disponibili. Il numero di osservazioni attuali secondo i date: 16.
La fonte (nome):
Indicatori dello sviluppo mondiale
La fonte (organizzazione):
World Bank, International Debt Statistics.
Categorie:
External Debt
sono stati aggiornati
23 apr 2017 anni
Indicatori delle variazioni dei valori per anni
In media:
1.254 Mln
Minima:
4.0 Mille.
1 gen 2011 anni
Massimo:
10.089 Mln
1 gen 2016 anni
Alla data di osservazione
Valore
Variazione assoluta
La variazione rispetto al valore precedente
1 gen 1971 anni
144.0 Mille.
+144.0 Mille.
0.0%
1 gen 1972 anni
139.0 Mille.
-5.0 Mille.
-3.47%
1 gen 1973 anni
133.0 Mille.
-6.0 Mille.
-4.32%
1 gen 1974 anni
215.0 Mille.
+82.0 Mille.
61.65%
1 gen 1975 anni
306.0 Mille.
+91.0 Mille.
42.33%
1 gen 1976 anni
732.0 Mille.
+426.0 Mille.
139.22%
1 gen 1977 anni
607.0 Mille.
-125.0 Mille.
-17.08%
1 gen 1978 anni
733.0 Mille.
+126.0 Mille.
20.76%
1 gen 1979 anni
414.0 Mille.
-319.0 Mille.
-43.52%
1 gen 1980 anni
413.0 Mille.
-1000.0
-0.24%
1 gen 2011 anni
4.0 Mille.
-409.0 Mille.
-99.03%
1 gen 2012 anni
67.0 Mille.
+63.0 Mille.
1.57 Mille.%
1 gen 2013 anni
92.0 Mille.
+25.0 Mille.
37.31%
1 gen 2014 anni
1.068 Mln
+976.0 Mille.
1.06 Mille.%
1 gen 2015 anni
4.91 Mln
+3.842 Mln
359.74%
1 gen 2016 anni
10.089 Mln
+5.179 Mln
105.48%
Classificazione dei paesi secondo i statistiche attuali per anni
