29
/it/
it
AIzaSyAYiBZKx7MnpbEhh9jyipgxe19OcubqV5w
April 1, 2024
174393
Lao PDR
LAO
true
2
1
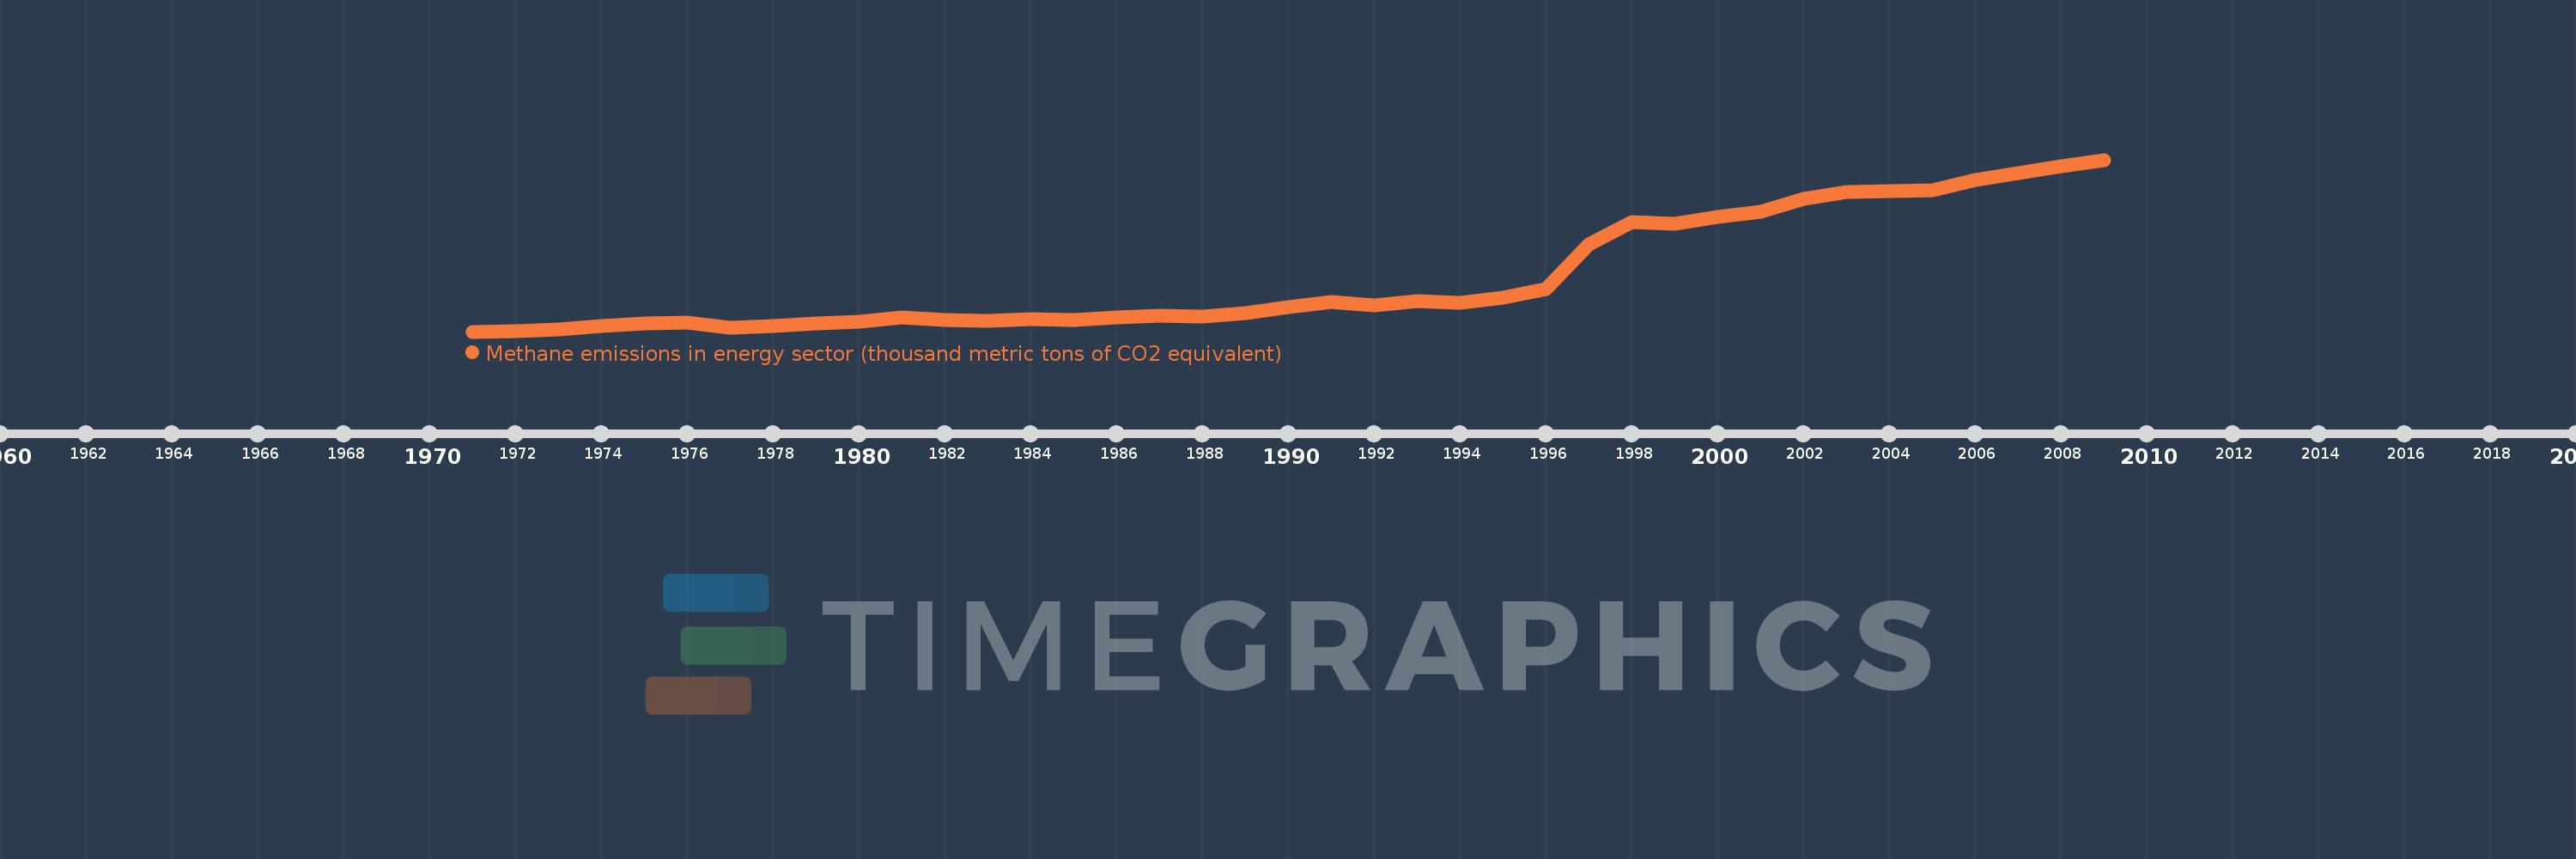
Methane emissions in energy sector (thousand metric tons of CO2 equivalent)
2009,2008,2007,2006,2005,2004,2003,2002,2001,2000,1999,1998,1997,1996,1995,1994,1993,1992,1991,1990,1989,1988,1987,1986,1985,1984,1983,1982,1981,1980,1979,1978,1977,1976,1975,1974,1973,1972,1971
Queste statistiche in altri paesi:
AfghanistanAlbaniaAlgeriaAmerican SamoaAndorraAngolaAntigua and BarbudaArab WorldArgentinaArmeniaArubaAustraliaAustriaAzerbaijanBahamas, TheBahrainBangladeshBarbadosBelarusBelgiumBelizeBeninBermudaBhutanBoliviaBosnia and HerzegovinaBotswanaBrazilBritish Virgin IslandsBrunei DarussalamBulgariaBurkina FasoBurundiCabo VerdeCambodiaCameroonCanadaCaribbean small statesCayman IslandsCentral African RepublicCentral Europe and the BalticsChadChannel IslandsChileChinaColombiaComorosCongo, Dem. Rep.Congo, Rep.Costa RicaCote d'IvoireCroatiaCubaCuracaoCyprusCzech RepublicDenmarkDjiboutiDominicaDominican RepublicEarly-demographic dividendEast Asia & PacificEast Asia & Pacific (excluding high income)East Asia & Pacific (IDA & IBRD countries)EcuadorEgypt, Arab Rep.El SalvadorEquatorial GuineaEritreaEstoniaEthiopiaEuro areaEurope & Central AsiaEurope & Central Asia (excluding high income)Europe & Central Asia (IDA & IBRD countries)European UnionFaroe IslandsFijiFinlandFragile and conflict affected situationsFranceFrench PolynesiaGabonGambia, TheGeorgiaGermanyGhanaGibraltarGreeceGreenlandGrenadaGuamGuatemalaGuineaGuinea-BissauGuyanaHaitiHeavily indebted poor countries (HIPC)High incomeHondurasHong Kong SAR, ChinaHungaryIBRD onlyIcelandIDA & IBRD totalIDA blendIDA onlyIDA totalIndiaIndonesiaIran, Islamic Rep.IraqIrelandIsle of ManIsraelItalyJamaicaJapanJordanKazakhstanKenyaKiribatiKorea, Dem. People’s Rep.Korea, Rep.KosovoKuwaitKyrgyz RepublicLao PDRLate-demographic dividendLatin America & Caribbean Latin America & Caribbean (excluding high income)Latin America & the Caribbean (IDA & IBRD countries)LatviaLeast developed countries: UN classificationLebanonLesothoLiberiaLibyaLiechtensteinLithuaniaLow & middle incomeLow incomeLower middle incomeLuxembourgMacao SAR, ChinaMacedonia, FYRMadagascarMalawiMalaysiaMaldivesMaliMaltaMarshall IslandsMauritaniaMauritiusMexicoMicronesia, Fed. Sts.Middle East & North AfricaMiddle East & North Africa (excluding high income)Middle East & North Africa (IDA & IBRD countries)Middle incomeMoldovaMonacoMongoliaMontenegroMoroccoMozambiqueMyanmarNamibiaNauruNepalNetherlandsNew CaledoniaNew ZealandNicaraguaNigerNigeriaNorth AmericaNorthern Mariana IslandsNorwayOECD membersOmanOther small statesPacific island small statesPakistanPalauPanamaPapua New GuineaParaguayPeruPhilippinesPolandPortugalPost-demographic dividendPre-demographic dividendPuerto RicoQatarRomaniaRussian FederationRwandaSamoaSan MarinoSao Tome and PrincipeSaudi ArabiaSenegalSerbiaSeychellesSierra LeoneSingaporeSint Maarten (Dutch part)Slovak RepublicSloveniaSmall statesSolomon IslandsSomaliaSouth AfricaSouth AsiaSouth Asia (IDA & IBRD)South SudanSpainSri LankaSt. Kitts and NevisSt. LuciaSt. Martin (French part)St. Vincent and the GrenadinesSub-Saharan Africa Sub-Saharan Africa (excluding high income)Sub-Saharan Africa (IDA & IBRD countries)SudanSurinameSwazilandSwedenSwitzerlandSyrian Arab RepublicTajikistanTanzaniaThailandTimor-LesteTogoTongaTrinidad and TobagoTunisiaTurkeyTurkmenistanTurks and Caicos IslandsTuvaluUgandaUkraineUnited Arab EmiratesUnited KingdomUnited StatesUpper middle incomeUruguayUzbekistanVanuatuVenezuela, RBVietnamVirgin Islands (U.S.)West Bank and GazaWorldYemen, Rep.ZambiaZimbabwe Linea del tempo:
Questa scala temporale mostra un grafico dal 1971 anno al 2009 anno. Lao PDR. I dati fino ad 1970 anno non disponibili. Il numero di osservazioni attuali secondo i date: 39.
La fonte (nome):
Indicatori dello sviluppo mondiale
La fonte (organizzazione):
European Commission, Joint Research Centre (JRC)/Netherlands Environmental Assessment Agency (PBL). Emission Database for Global Atmospheric Research (EDGAR): http://edgar.jrc.ec.europa.eu/
Categorie:
Energy & Mining, Environment
sono stati aggiornati
23 apr 2017 anni
Indicatori delle variazioni dei valori per anni
Minima:
460.813
1 gen 1971 anni
Massimo:
804.615
1 gen 2009 anni
Alla data di osservazione
Valore
Variazione assoluta
La variazione rispetto al valore precedente
1 gen 1971 anni
460.813
+460.813
0.0%
1 gen 1972 anni
461.463
+0.65
0.14%
1 gen 1973 anni
464.374
+2.911
0.63%
1 gen 1974 anni
472.146
+7.772
1.67%
1 gen 1975 anni
476.866
+4.721
1.0%
1 gen 1976 anni
478.42
+1.553
0.33%
1 gen 1977 anni
468.781
-9.639
-2.01%
1 gen 1978 anni
471.848
+3.067
0.65%
1 gen 1979 anni
477.468
+5.621
1.19%
1 gen 1980 anni
480.497
+3.028
0.63%
1 gen 1981 anni
489.616
+9.119
1.9%
1 gen 1982 anni
484.565
-5.051
-1.03%
1 gen 1983 anni
482.917
-1.648
-0.34%
1 gen 1984 anni
484.975
+2.058
0.43%
1 gen 1985 anni
484.433
-0.542
-0.11%
1 gen 1986 anni
488.951
+4.518
0.93%
1 gen 1987 anni
492.944
+3.993
0.82%
1 gen 1988 anni
491.451
-1.492
-0.3%
1 gen 1989 anni
498.206
+6.754
1.37%
1 gen 1990 anni
509.331
+11.125
2.23%
1 gen 1991 anni
519.724
+10.393
2.04%
1 gen 1992 anni
512.71
-7.014
-1.35%
1 gen 1993 anni
521.94
+9.23
1.8%
1 gen 1994 anni
518.422
-3.518
-0.67%
1 gen 1995 anni
528.785
+10.363
2.0%
1 gen 1996 anni
546.563
+17.778
3.36%
1 gen 1997 anni
636.036
+89.473
16.37%
1 gen 1998 anni
680.263
+44.227
6.95%
1 gen 1999 anni
677.105
-3.158
-0.46%
1 gen 2000 anni
690.706
+13.601
2.01%
1 gen 2001 anni
700.952
+10.246
1.48%
1 gen 2002 anni
725.584
+24.633
3.51%
1 gen 2003 anni
740.236
+14.651
2.02%
1 gen 2004 anni
742.29
+2.054
0.28%
1 gen 2005 anni
743.122
+0.833
0.11%
1 gen 2006 anni
763.934
+20.811
2.8%
1 gen 2007 anni
777.188
+13.254
1.73%
1 gen 2008 anni
791.566
+14.378
1.85%
1 gen 2009 anni
804.615
+13.049
1.65%
Classificazione dei paesi secondo i statistiche attuali per anni


Commenti: