29
/it/
it
AIzaSyAYiBZKx7MnpbEhh9jyipgxe19OcubqV5w
April 1, 2024
169738
Korea, Rep.
KOR
true
2
1
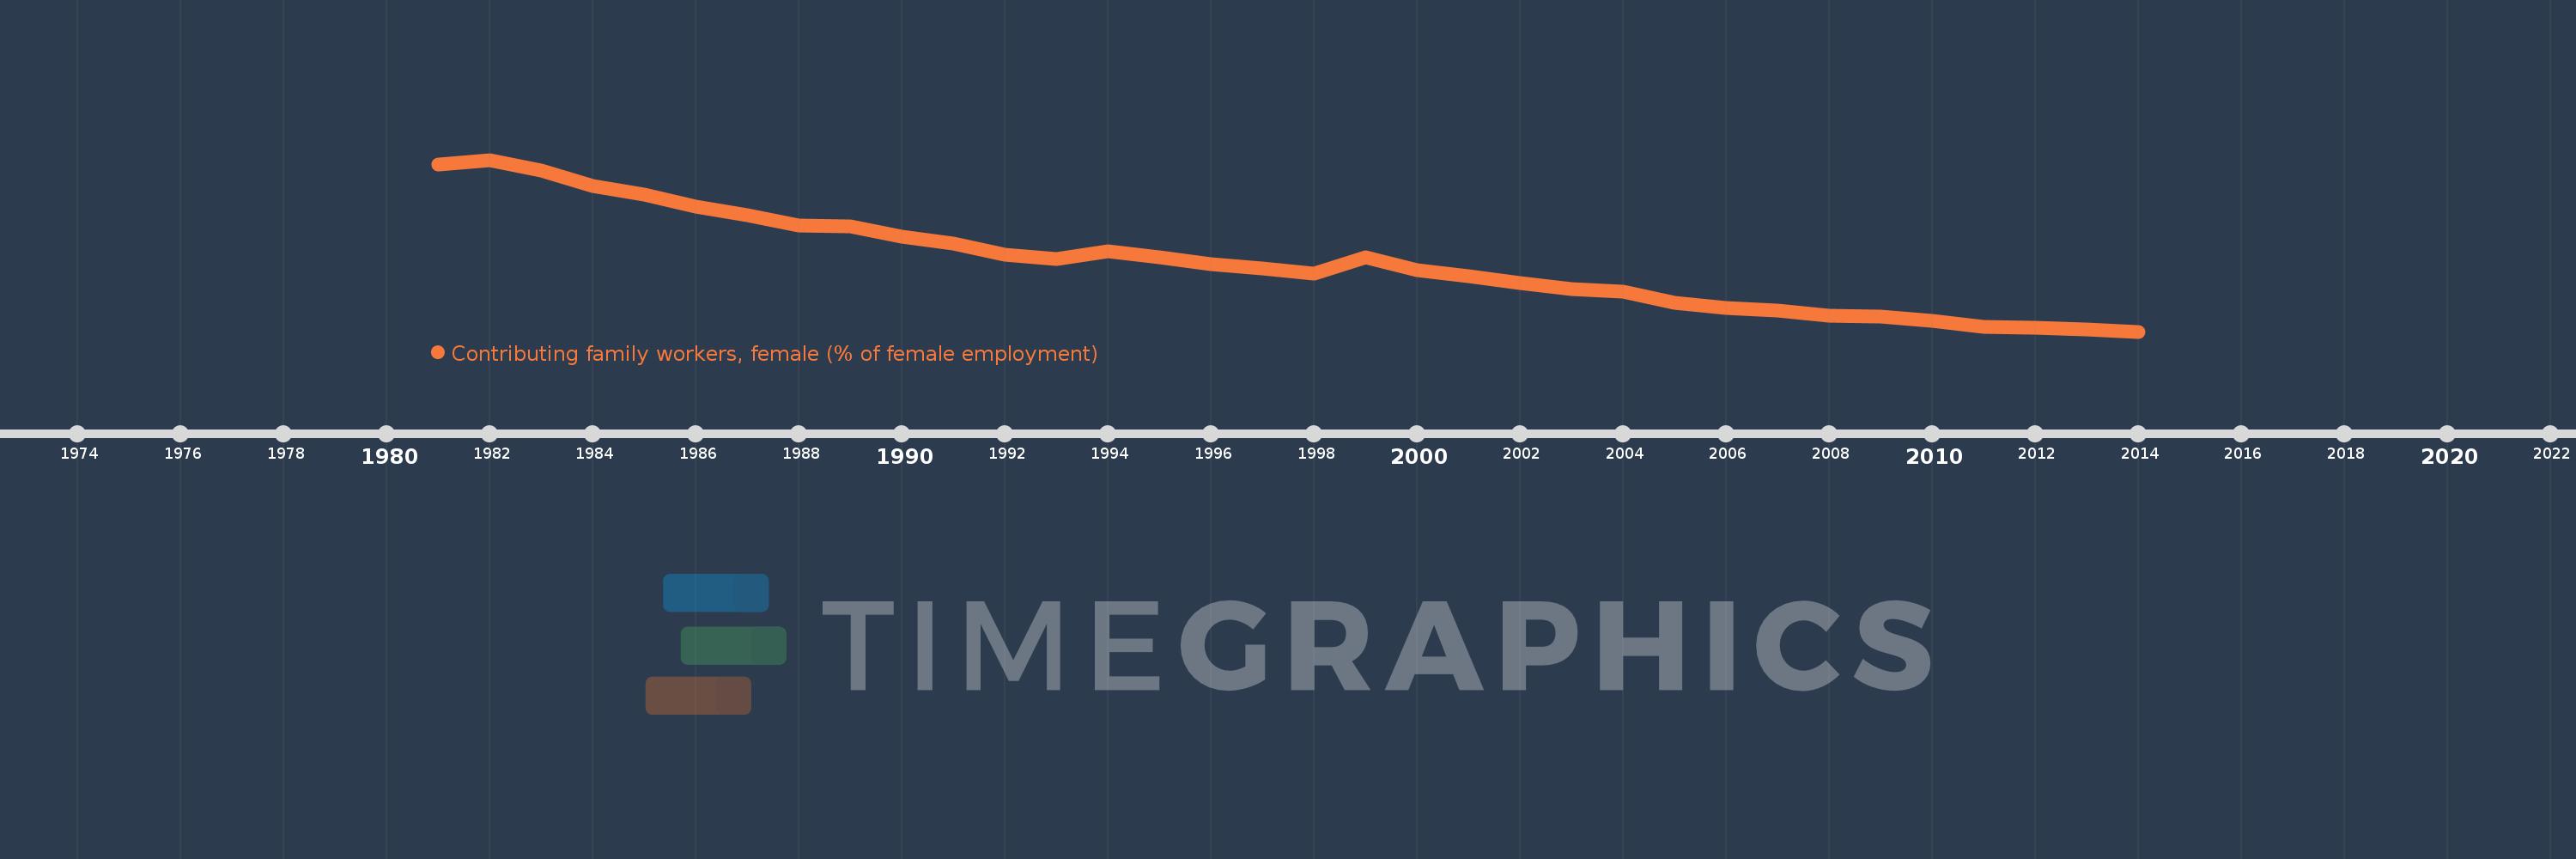
Contributing family workers, female (% of female employment)
2014,2013,2012,2011,2010,2009,2008,2007,2006,2005,2004,2003,2002,2001,2000,1999,1998,1997,1996,1995,1994,1993,1992,1991,1990,1989,1988,1987,1986,1985,1984,1983,1982,1981
Queste statistiche in altri paesi:
AlbaniaAlgeriaAmerican SamoaAntigua and BarbudaArgentinaArmeniaArubaAustraliaAustriaAzerbaijanBahamas, TheBahrainBangladeshBarbadosBelarusBelgiumBelizeBeninBermudaBhutanBoliviaBosnia and HerzegovinaBotswanaBrazilBritish Virgin IslandsBrunei DarussalamBulgariaBurkina FasoBurundiCabo VerdeCambodiaCameroonCanadaCaribbean small statesCayman IslandsCentral Europe and the BalticsChadChileColombiaCongo, Rep.Costa RicaCote d'IvoireCroatiaCyprusCzech RepublicDenmarkDominicaDominican RepublicEarly-demographic dividendEcuadorEgypt, Arab Rep.El SalvadorEquatorial GuineaEstoniaEthiopiaEuro areaEurope & Central AsiaEurope & Central Asia (excluding high income)Europe & Central Asia (IDA & IBRD countries)European UnionFijiFinlandFranceFrench PolynesiaGabonGambia, TheGeorgiaGermanyGhanaGreeceGrenadaGuatemalaGuineaHaitiHigh incomeHondurasHong Kong SAR, ChinaHungaryIcelandIndiaIndonesiaIran, Islamic Rep.IrelandIsraelItalyJamaicaJapanJordanKazakhstanKenyaKiribatiKorea, Rep.KosovoKuwaitKyrgyz RepublicLao PDRLatin America & Caribbean Latin America & Caribbean (excluding high income)Latin America & the Caribbean (IDA & IBRD countries)LatviaLebanonLesothoLiberiaLithuaniaLower middle incomeLuxembourgMacao SAR, ChinaMacedonia, FYRMadagascarMalawiMalaysiaMaldivesMaliMaltaMarshall IslandsMauritiusMexicoMiddle East & North Africa (excluding high income)Middle East & North Africa (IDA & IBRD countries)MoldovaMongoliaMontenegroMoroccoMozambiqueNamibiaNepalNetherlandsNew CaledoniaNew ZealandNicaraguaNigerNorth AmericaNorwayOECD membersPakistanPanamaParaguayPeruPhilippinesPolandPortugalPost-demographic dividendPuerto RicoQatarRomaniaRussian FederationRwandaSamoaSan MarinoSao Tome and PrincipeSaudi ArabiaSenegalSerbiaSeychellesSierra LeoneSingaporeSlovak RepublicSloveniaSouth AfricaSouth AsiaSouth Asia (IDA & IBRD)SpainSri LankaSt. Kitts and NevisSt. LuciaSt. Vincent and the GrenadinesSurinameSwazilandSwedenSwitzerlandSyrian Arab RepublicTajikistanTanzaniaThailandTimor-LesteTogoTongaTrinidad and TobagoTunisiaTurkeyTuvaluUgandaUkraineUnited Arab EmiratesUnited KingdomUnited StatesUruguayVanuatuVenezuela, RBVietnamWest Bank and GazaYemen, Rep.ZambiaZimbabwe Linea del tempo:
Questa scala temporale mostra un grafico dal 1981 anno al 2014 anno. Korea, Rep.. I dati fino ad 1980 anno non disponibili. Il numero di osservazioni attuali secondo i date: 34.
La fonte (nome):
Indicatori dello sviluppo mondiale
La fonte (organizzazione):
International Labour Organization, Key Indicators of the Labour Market database.
Categorie:
Social Protection & Labor, Gender
sono stati aggiornati
23 apr 2017 anni
Indicatori delle variazioni dei valori per anni
Minima:
10.1
1 gen 2014 anni
Massimo:
38.2
1 gen 1982 anni
Alla data di osservazione
Valore
Variazione assoluta
La variazione rispetto al valore precedente
1 gen 1981 anni
37.4
+37.4
0.0%
1 gen 1982 anni
38.2
+0.8
2.14%
1 gen 1983 anni
36.4
-1.8
-4.71%
1 gen 1984 anni
33.9
-2.5
-6.87%
1 gen 1985 anni
32.5
-1.4
-4.13%
1 gen 1986 anni
30.6
-1.9
-5.85%
1 gen 1987 anni
29.2
-1.4
-4.58%
1 gen 1988 anni
27.4
-1.8
-6.16%
1 gen 1989 anni
27.3
-0.1
-0.36%
1 gen 1990 anni
25.6
-1.7
-6.23%
1 gen 1991 anni
24.5
-1.1
-4.3%
1 gen 1992 anni
22.7
-1.8
-7.35%
1 gen 1993 anni
22.0
-0.7
-3.08%
1 gen 1994 anni
23.2
+1.2
5.45%
1 gen 1995 anni
22.2
-1.0
-4.31%
1 gen 1996 anni
21.1
-1.1
-4.95%
1 gen 1997 anni
20.4
-0.7
-3.32%
1 gen 1998 anni
19.6
-0.8
-3.92%
1 gen 1999 anni
22.2
+2.6
13.27%
1 gen 2000 anni
20.1
-2.1
-9.46%
1 gen 2001 anni
19.2
-0.9
-4.48%
1 gen 2002 anni
18.1
-1.1
-5.73%
1 gen 2003 anni
17.1
-1.0
-5.52%
1 gen 2004 anni
16.7
-0.4
-2.34%
1 gen 2005 anni
14.8
-1.9
-11.38%
1 gen 2006 anni
13.9
-0.9
-6.08%
1 gen 2007 anni
13.5
-0.4
-2.88%
1 gen 2008 anni
12.7
-0.8
-5.93%
1 gen 2009 anni
12.5
-0.2
-1.57%
1 gen 2010 anni
11.9
-0.6
-4.8%
1 gen 2011 anni
10.9
-1.0
-8.4%
1 gen 2012 anni
10.7
-0.2
-1.83%
1 gen 2013 anni
10.5
-0.2
-1.87%
1 gen 2014 anni
10.1
-0.4
-3.81%
Classificazione dei paesi secondo i statistiche attuali per anni


Commenti: