30
/it/
AIzaSyAYiBZKx7MnpbEhh9jyipgxe19OcubqV5w
April 1, 2024
169379
Korea, Dem. People’s Rep.
PRK
true
2
1
Net bilateral aid flows from DAC donors, Finland (current US$)
2015,2014,2013,2012,2011,2010,2009,2008,2007,2006,2005,2004,2003,2002,1999,1998,1997
Download
Biblioteca di statistiche globali →Korea, Dem. People’s Rep. →

Net bilateral aid flows from DAC donors, Finland (current US$)

Queste statistiche in altri paesi:

AfghanistanAlbaniaAlgeriaAngolaAntigua and BarbudaArab WorldArgentinaArmeniaAzerbaijanBahamas, TheBahrainBangladeshBarbadosBelarusBelizeBeninBhutanBoliviaBosnia and HerzegovinaBotswanaBrazilBrunei DarussalamBulgariaBurkina FasoBurundiCabo VerdeCambodiaCameroonCaribbean small statesCayman IslandsCentral African RepublicCentral Europe and the BalticsChadChileChinaColombiaComorosCongo, Dem. Rep.Congo, Rep.Costa RicaCote d'IvoireCroatiaCubaCyprusCzech RepublicDjiboutiDominicaDominican RepublicEast Asia & PacificEast Asia & Pacific (excluding high income)East Asia & Pacific (IDA & IBRD countries)EcuadorEgypt, Arab Rep.El SalvadorEquatorial GuineaEritreaEstoniaEthiopiaEuro areaEurope & Central AsiaEurope & Central Asia (excluding high income)Europe & Central Asia (IDA & IBRD countries)European UnionFijiFragile and conflict affected situationsFrench PolynesiaGabonGambia, TheGeorgiaGhanaGrenadaGuatemalaGuineaGuinea-BissauGuyanaHaitiHeavily indebted poor countries (HIPC)High incomeHondurasHong Kong SAR, ChinaHungaryIBRD onlyIDA & IBRD totalIDA blendIDA onlyIDA totalIndiaIndonesiaIran, Islamic Rep.IraqIsraelJamaicaJordanKazakhstanKenyaKiribatiKorea, Dem. People’s Rep.Korea, Rep.KosovoKuwaitKyrgyz RepublicLao PDRLatin America & Caribbean Latin America & Caribbean (excluding high income)Latin America & the Caribbean (IDA & IBRD countries)LatviaLeast developed countries: UN classificationLebanonLesothoLiberiaLibyaLithuaniaLow & middle incomeLow incomeLower middle incomeMacedonia, FYRMadagascarMalawiMalaysiaMaldivesMaliMauritaniaMauritiusMexicoMiddle East & North AfricaMiddle East & North Africa (excluding high income)Middle East & North Africa (IDA & IBRD countries)Middle incomeMoldovaMongoliaMontenegroMoroccoMozambiqueMyanmarNamibiaNepalNew CaledoniaNicaraguaNigerNigeriaNorthern Mariana IslandsOECD membersOmanOther small statesPacific island small statesPakistanPalauPanamaPapua New GuineaParaguayPeruPhilippinesPolandRomaniaRussian FederationRwandaSamoaSao Tome and PrincipeSaudi ArabiaSenegalSerbiaSeychellesSierra LeoneSingaporeSlovak RepublicSmall statesSolomon IslandsSomaliaSouth AfricaSouth AsiaSouth Asia (IDA & IBRD)South SudanSri LankaSt. Kitts and NevisSt. LuciaSt. Vincent and the GrenadinesSub-Saharan Africa Sub-Saharan Africa (excluding high income)Sub-Saharan Africa (IDA & IBRD countries)SudanSurinameSwazilandSyrian Arab RepublicTajikistanTanzaniaThailandTimor-LesteTogoTongaTrinidad and TobagoTunisiaTurkeyTurkmenistanTuvaluUgandaUkraineUnited Arab EmiratesUpper middle incomeUruguayUzbekistanVanuatuVenezuela, RBVietnamWest Bank and GazaWorldYemen, Rep.ZambiaZimbabwe

Linea del tempo:

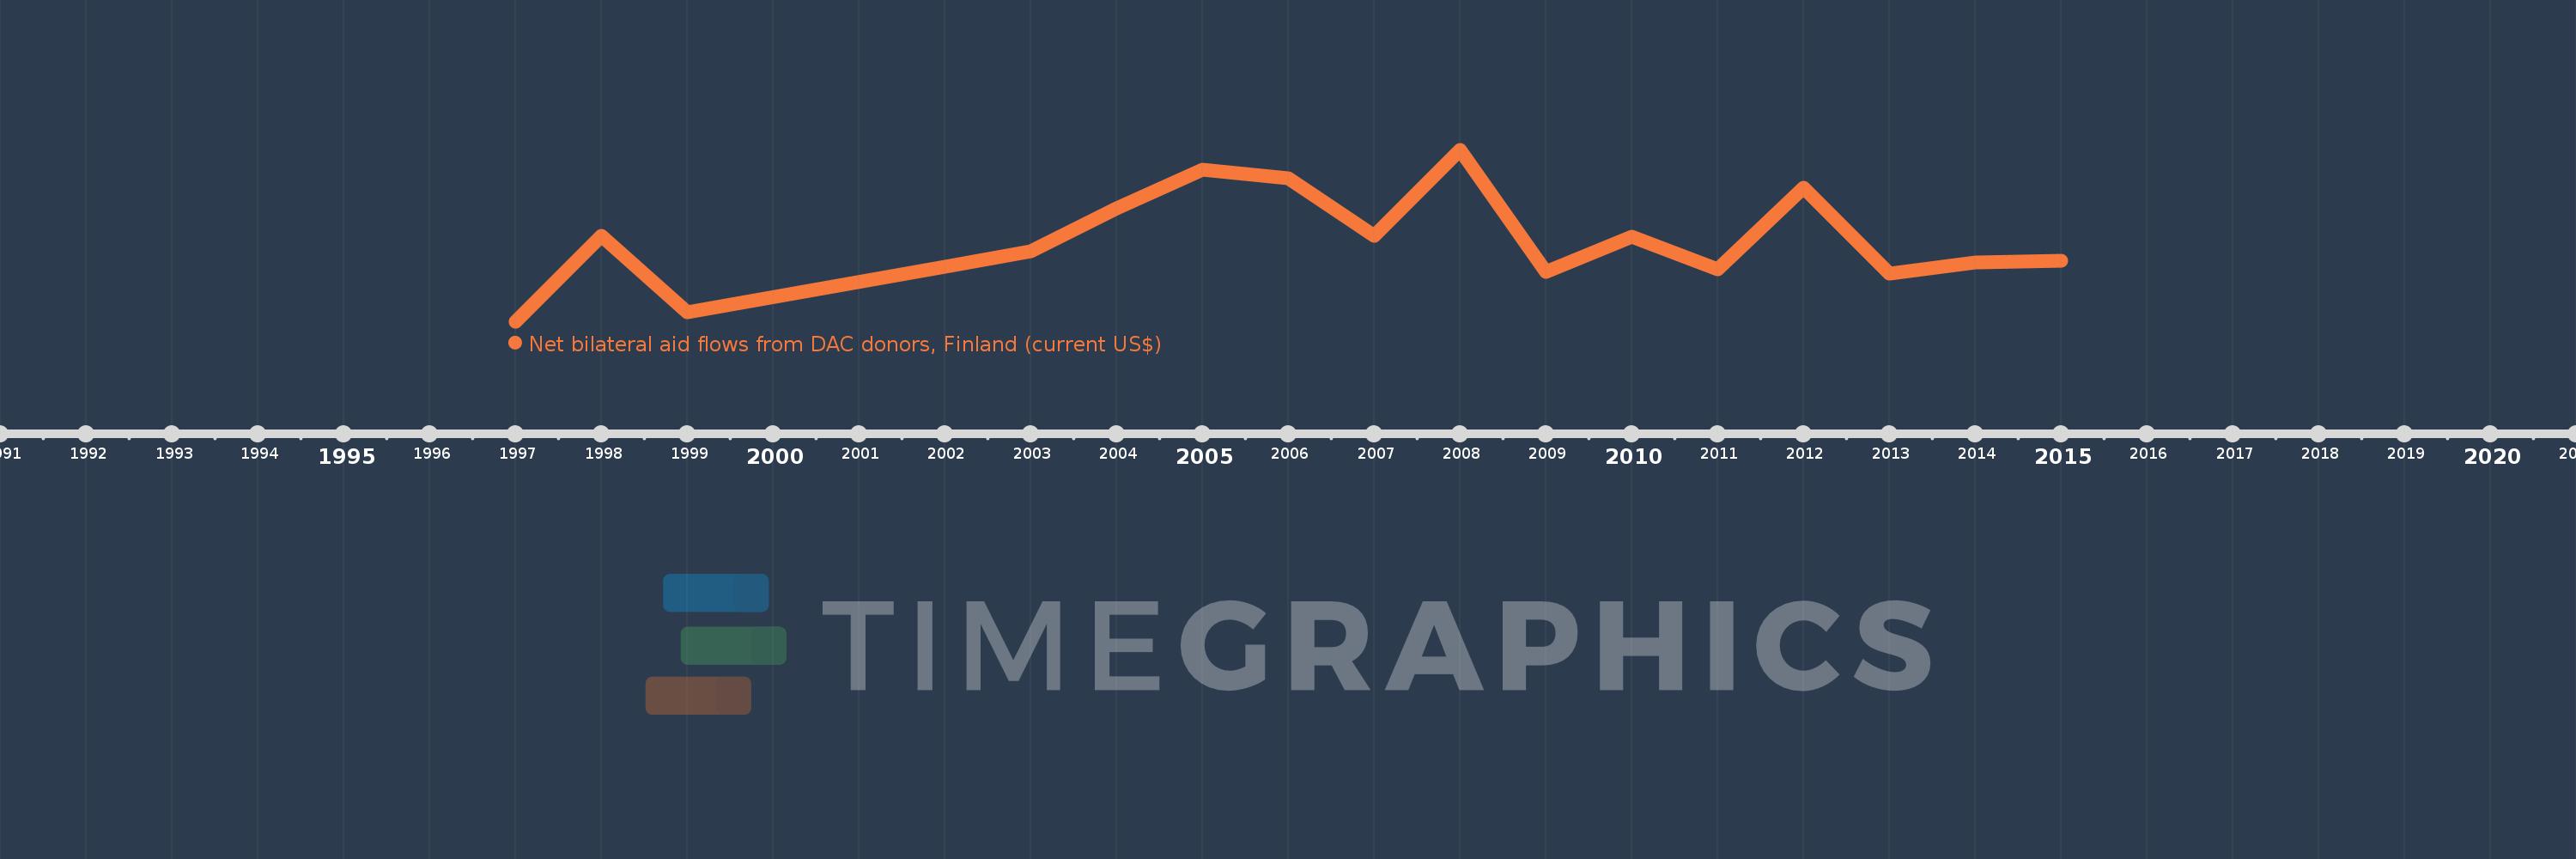
Questa scala temporale mostra un grafico dal 1997 anno al 2015 anno. Korea, Dem. People’s Rep.. I dati fino ad 1996 anno non disponibili. Il numero di osservazioni attuali secondo i date: 17.

La fonte (nome):

Indicatori dello sviluppo mondiale

La fonte (organizzazione):

Development Assistance Committee of the Organisation for Economic Co-operation and Development, Geographical Distribution of Financial Flows to Developing Countries, Development Co-operation Report, and International Development Statistics database. Data are available online at: www.oecd.org/dac/stats/idsonline.

Categorie:

Aid Effectiveness

sono stati aggiornati

23 apr 2017 anni

Indicatori delle variazioni dei valori per anni

In media:
1.068 Mln
Minima:
70.0 Mille.
1 gen 1997 anni
Massimo:
2.18 Mln
1 gen 2008 anni
Alla data di osservazione
Valore
Variazione assoluta
La variazione rispetto al valore precedente
1 gen 1997 anni
70.0 Mille.
+70.0 Mille.
0.0%
1 gen 1998 anni
1.13 Mln
+1.06 Mln
1.51 Mille.%
1 gen 1999 anni
190.0 Mille.
-940.0 Mille.
-83.19%
1 gen 2002 anni
750.0 Mille.
+560.0 Mille.
294.74%
1 gen 2003 anni
940.0 Mille.
+190.0 Mille.
25.33%
1 gen 2004 anni
1.47 Mln
+530.0 Mille.
56.38%
1 gen 2005 anni
1.94 Mln
+470.0 Mille.
31.97%
1 gen 2006 anni
1.84 Mln
-100.0 Mille.
-5.15%
1 gen 2007 anni
1.13 Mln
-710.0 Mille.
-38.59%
1 gen 2008 anni
2.18 Mln
+1.05 Mln
92.92%
1 gen 2009 anni
680.0 Mille.
-1.5 Mln
-68.81%
1 gen 2010 anni
1.12 Mln
+440.0 Mille.
64.71%
1 gen 2011 anni
720.0 Mille.
-400.0 Mille.
-35.71%
1 gen 2012 anni
1.72 Mln
+1000.0 Mille.
138.89%
1 gen 2013 anni
660.0 Mille.
-1.06 Mln
-61.63%
1 gen 2014 anni
800.0 Mille.
+140.0 Mille.
21.21%
1 gen 2015 anni
820.0 Mille.
+20.0 Mille.
2.5%

Classificazione dei paesi secondo i statistiche attuali per anni